Population estimation using vaccine survey
Estimation of population in England in certain age bands using the ONS vaccine survey
The table below shows the main estimate. The "Vax Survey" column is obtained simply by dividing (i) the number of people in the age band known to have been vaccinated with at least one dose by (ii) the most recent estimate of the proportion of people in that age band that have been vaccinated with at least one dose. This vaccination survey-derived estimate is certainly not incontestable but it provides an independent extra datapoint, one which generally tends to support the lower ONS 2020 population estimates over the NIMS population figures.
The source for (i), and also the ONS 2020 and NIMS population estimates, is NHS vaccine data or equivalently the Coronavirus dashboard using the metric "vaccinationsAgeDemographics", and the source for (ii) is the vaccine survey part of the ONS Coronavirus Infection Survey, table 1g.
| Ages | NIMS (millions) | ONS 2020 (millions) | Vax Survey (millions) |
|---|---|---|---|
| 16-24 | 6.68 | 6.05 | 5.12 ( 4.86 - 5.52 ) |
| 25-34 | 9.31 | 7.60 | 6.59 ( 6.44 - 6.79 ) |
| 35-49 | 12.76 | 10.85 | 10.08 ( 9.97 - 10.25 ) |
| 50-59 | 8.36 | 7.64 | 7.45 ( 7.41 - 7.52 ) |
| 60-64 | 3.51 | 3.20 | 3.21 ( 3.20 - 3.23 ) |
| 65-69 | 2.92 | 2.78 | 2.72 ( 2.71 - 2.73 ) |
| 70-74 | 2.86 | 2.81 | 2.72 ( 2.72 - 2.73 ) |
| 75-79 | 2.16 | 2.01 | 2.08 ( 2.07 - 2.09 ) |
| 80+ | 2.83 | 2.86 | 2.73 ( 2.72 - 2.75 ) |
You might wonder if we could have used another label instead of "vaccinated people" to make our population estimate. What if we knew the number (n) of people with blue eyes, and then we sampled some people at random and found a proportion p of our sample had blue eyes? In that case our population estimate would be n/p. But this doesn't work very well because we don't actually know how many people have blue eyes. And probably the best way to determine this number would be run the information flow the other way, sampling people at random and multiplying the measured proportion by our estimate of the population.
By the way, this is an example of the capture-recapture method of estimation - great explanation here by the inimitable Johnny Ball.
So we see that one of the things that is special about using "vaccinated people" as our label, rather than "blue eyes", is that we have a good handle on the exact number of people who are vaccinated. We know this number because the NIMS vaccination database works brilliantly for this purpose, accurately keeping track of those vaccinated. I'm not sure there are any other examples of properties like this with a known exact count over people in the country and which cover enough people (we may know the exact number of people in the Liverpool football team, but we're not likely to come across any in a sensible-sized random survey of the country because there are too few of them).
Another key point is that we need the survey to be one where the pollsters go to a lot of trouble to seek out everyone, and try hard to correct for those they didn't find. And it has to be a survey which is age-stratified, because we want to know the population in various age bands. Possibly the vaccination survey is the only one that meets all these criteria right now, though when the preliminary results from Census 2021 are published in March 2022 we should get a better idea of the population.
The Problem
The problem is, we don't know very accurately how many people there are in the country. Why is this a problem for managing Covid-19? Because we really want to know the number of unvaccinated people.
Need to know how many at risk: affects modelling, policy, planning. Need to know how well vaccines work.
https://www.ft.com/content/125fbaf8-175a-4e2e-852a-9995ca5176b2
https://www.covid-arg.com/post/vaccine-effectiveness-and-population-estimates
Other stuff
Can see how the estimate evolves over time. Should in theory be constant, but . Potentially get a better estimate out of it.
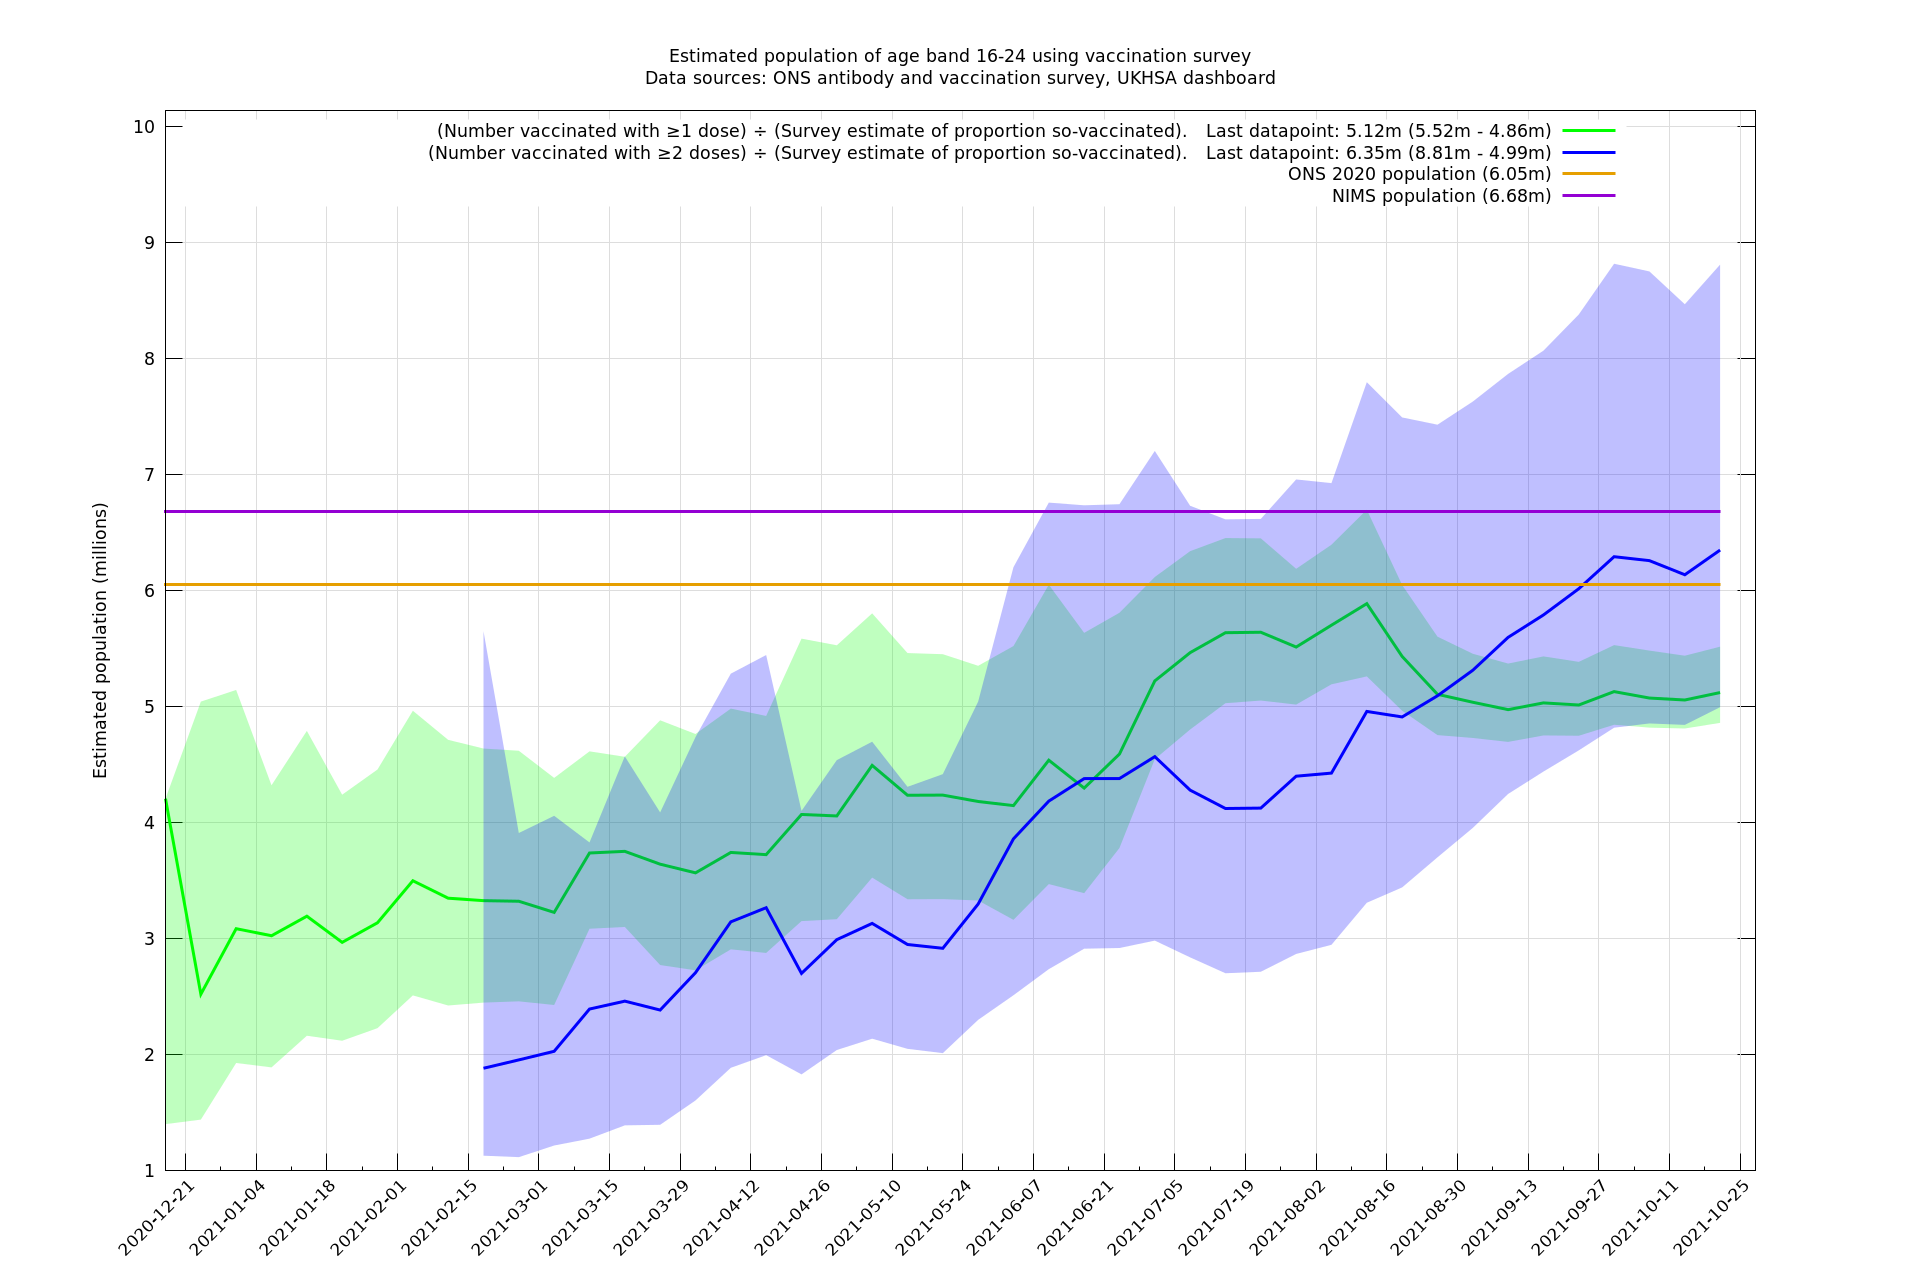
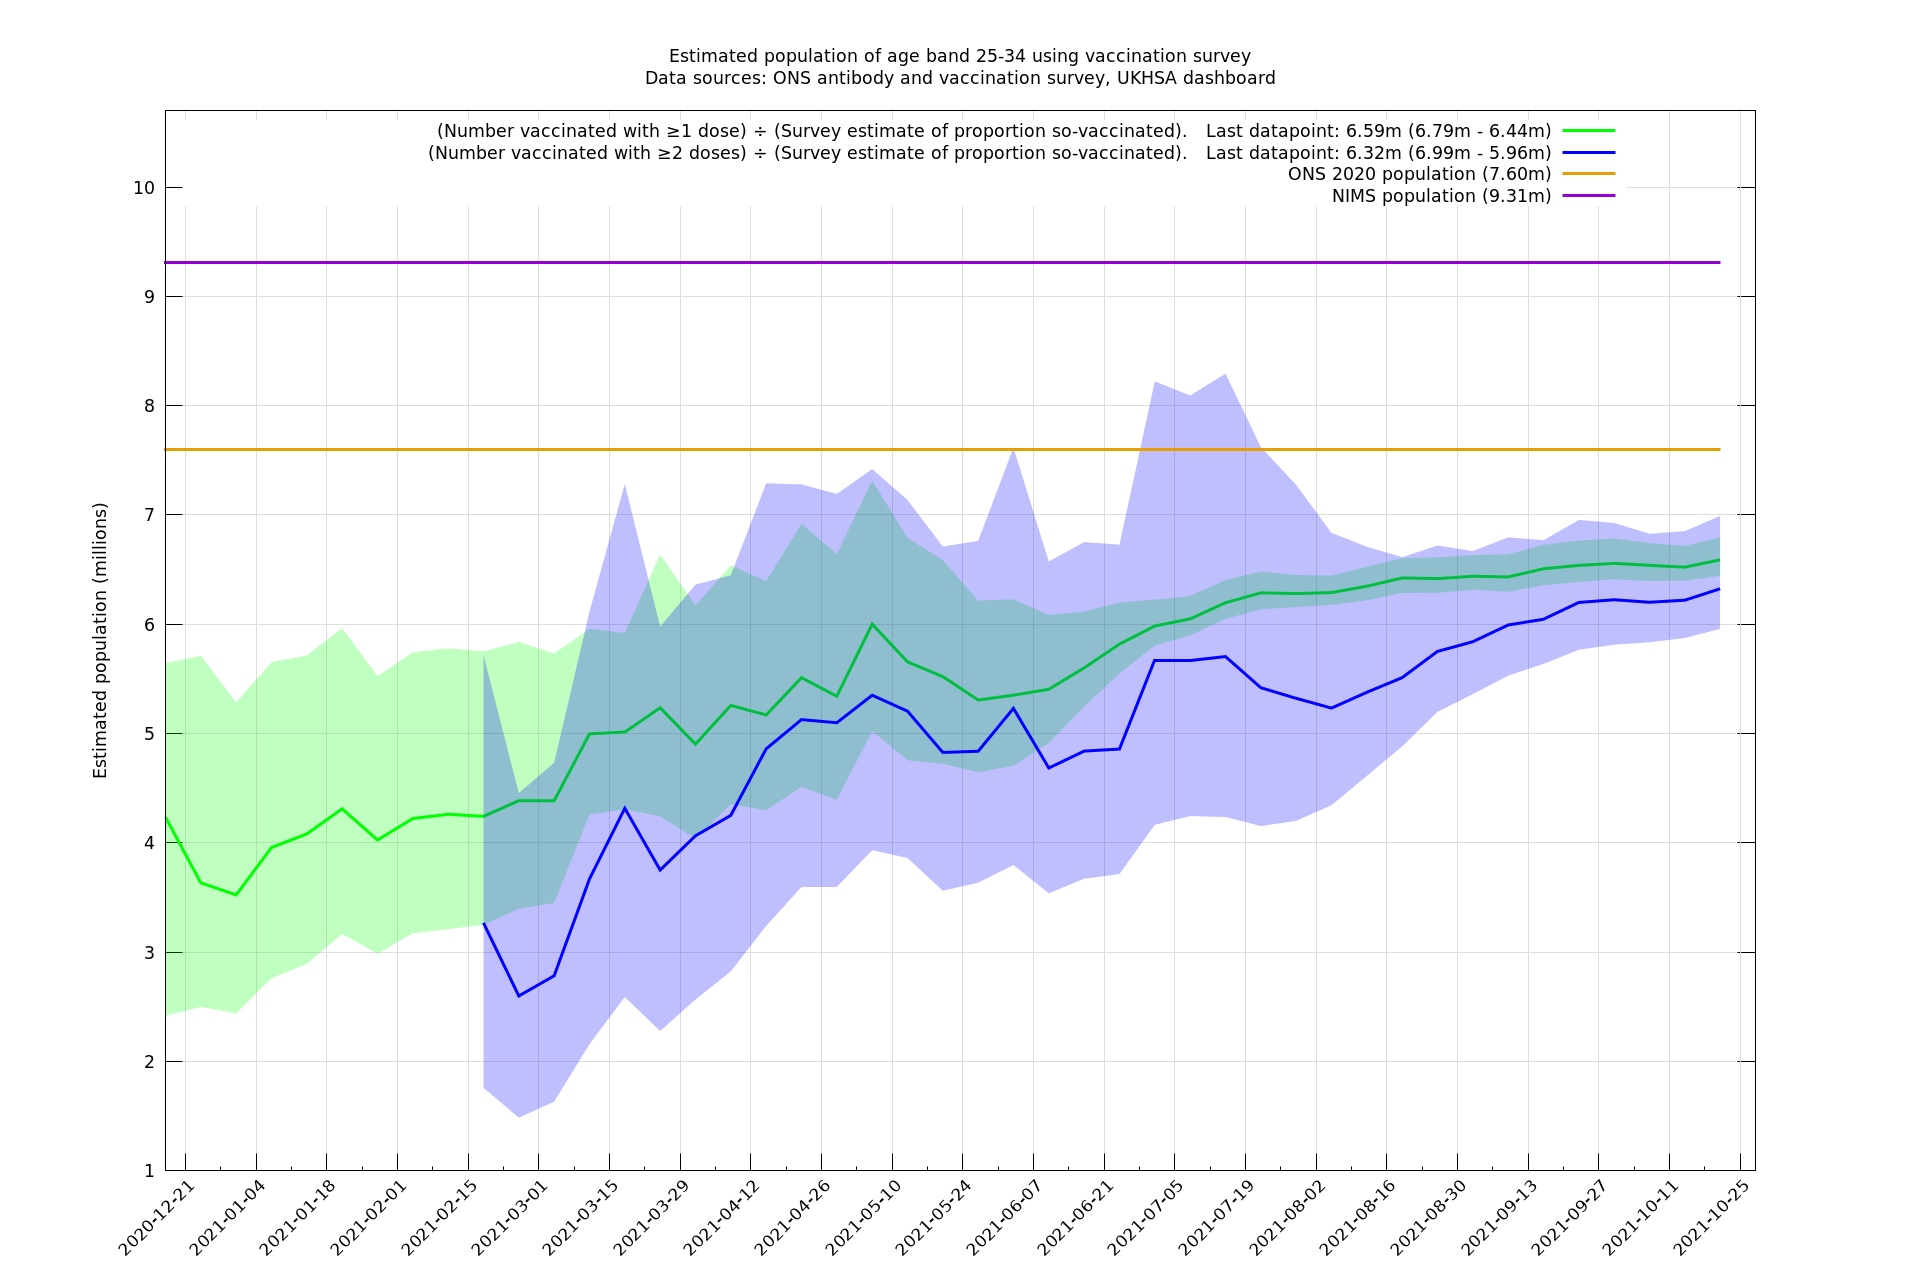
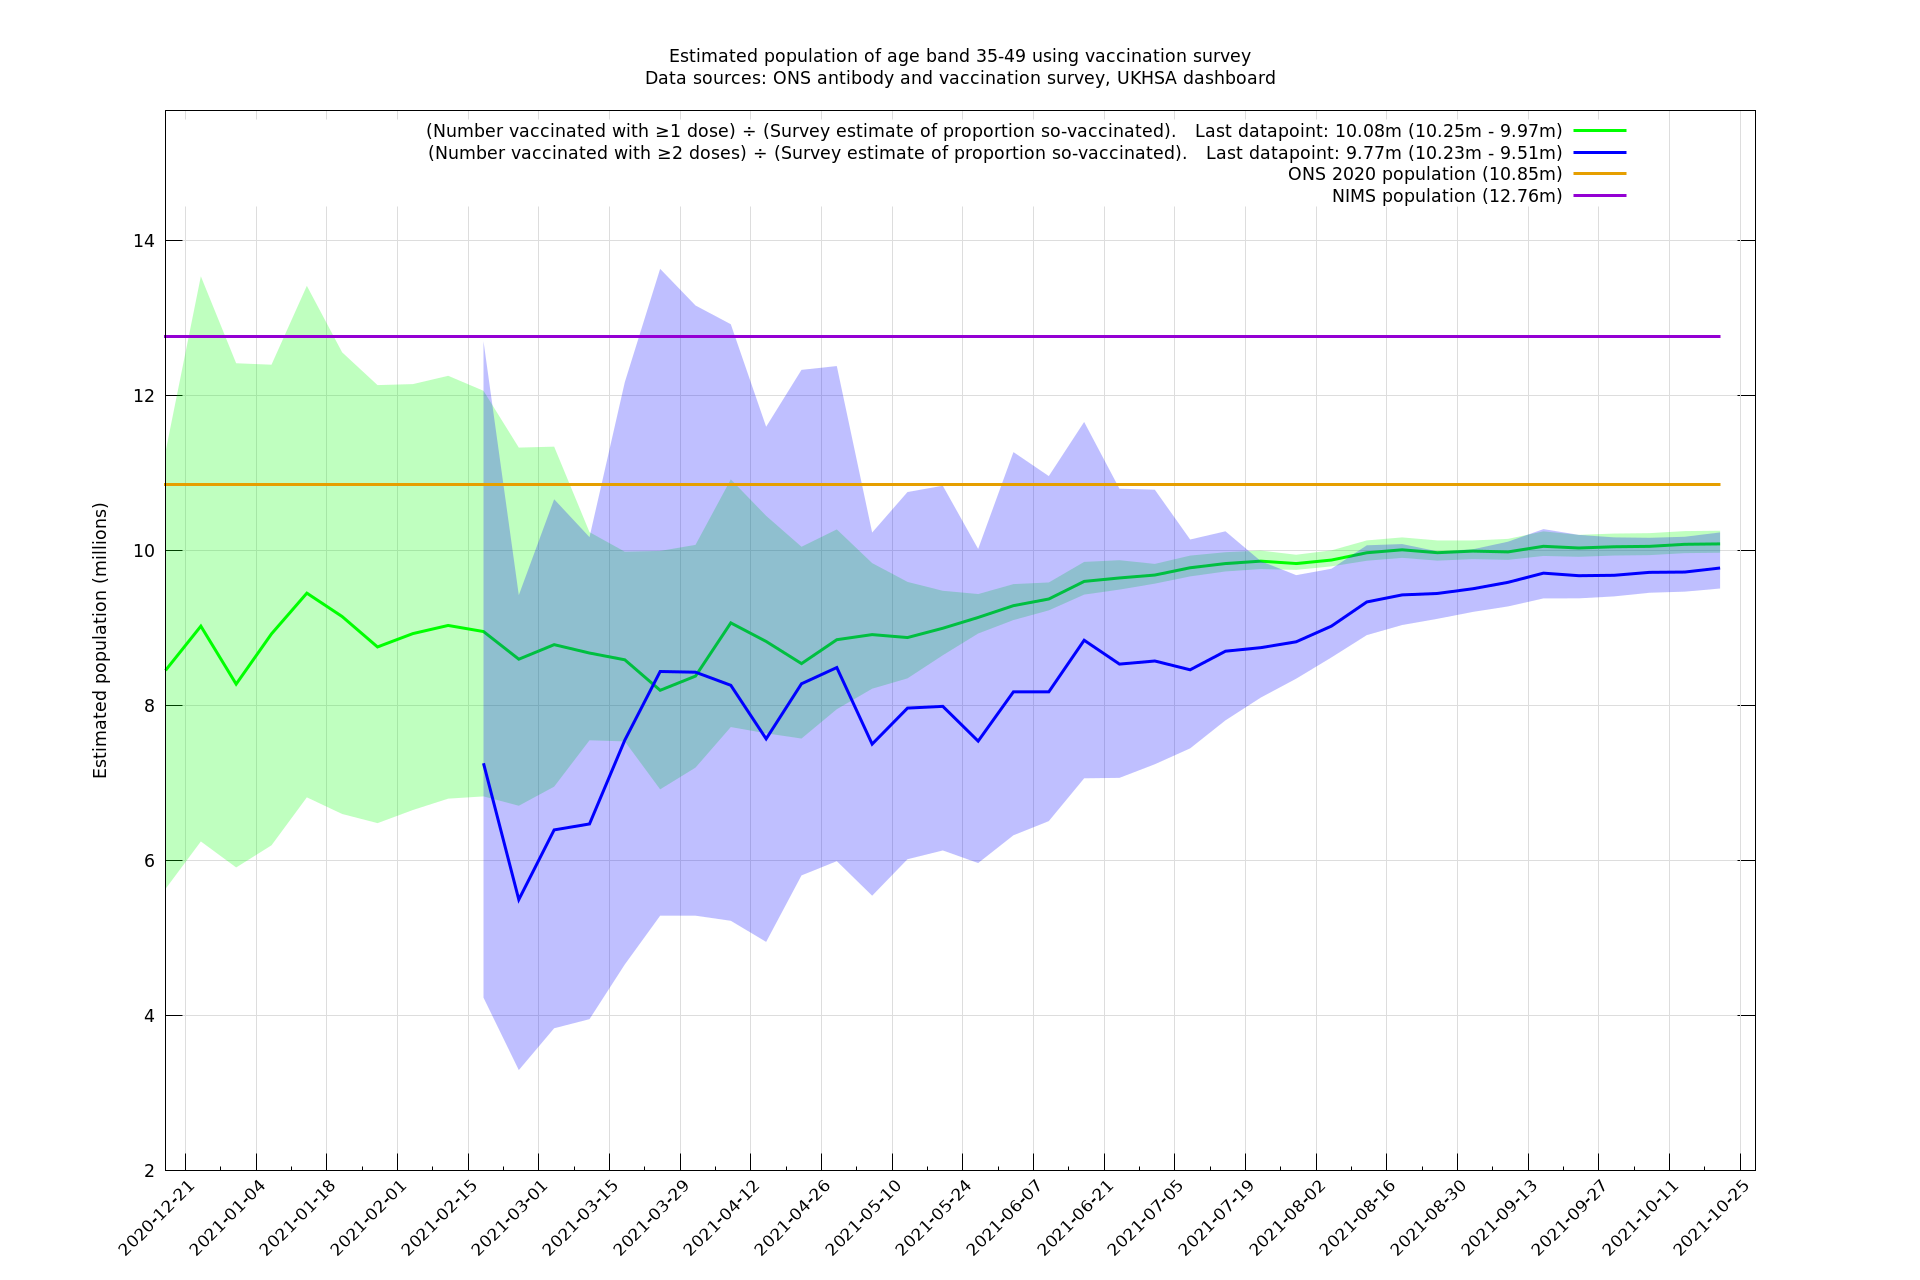
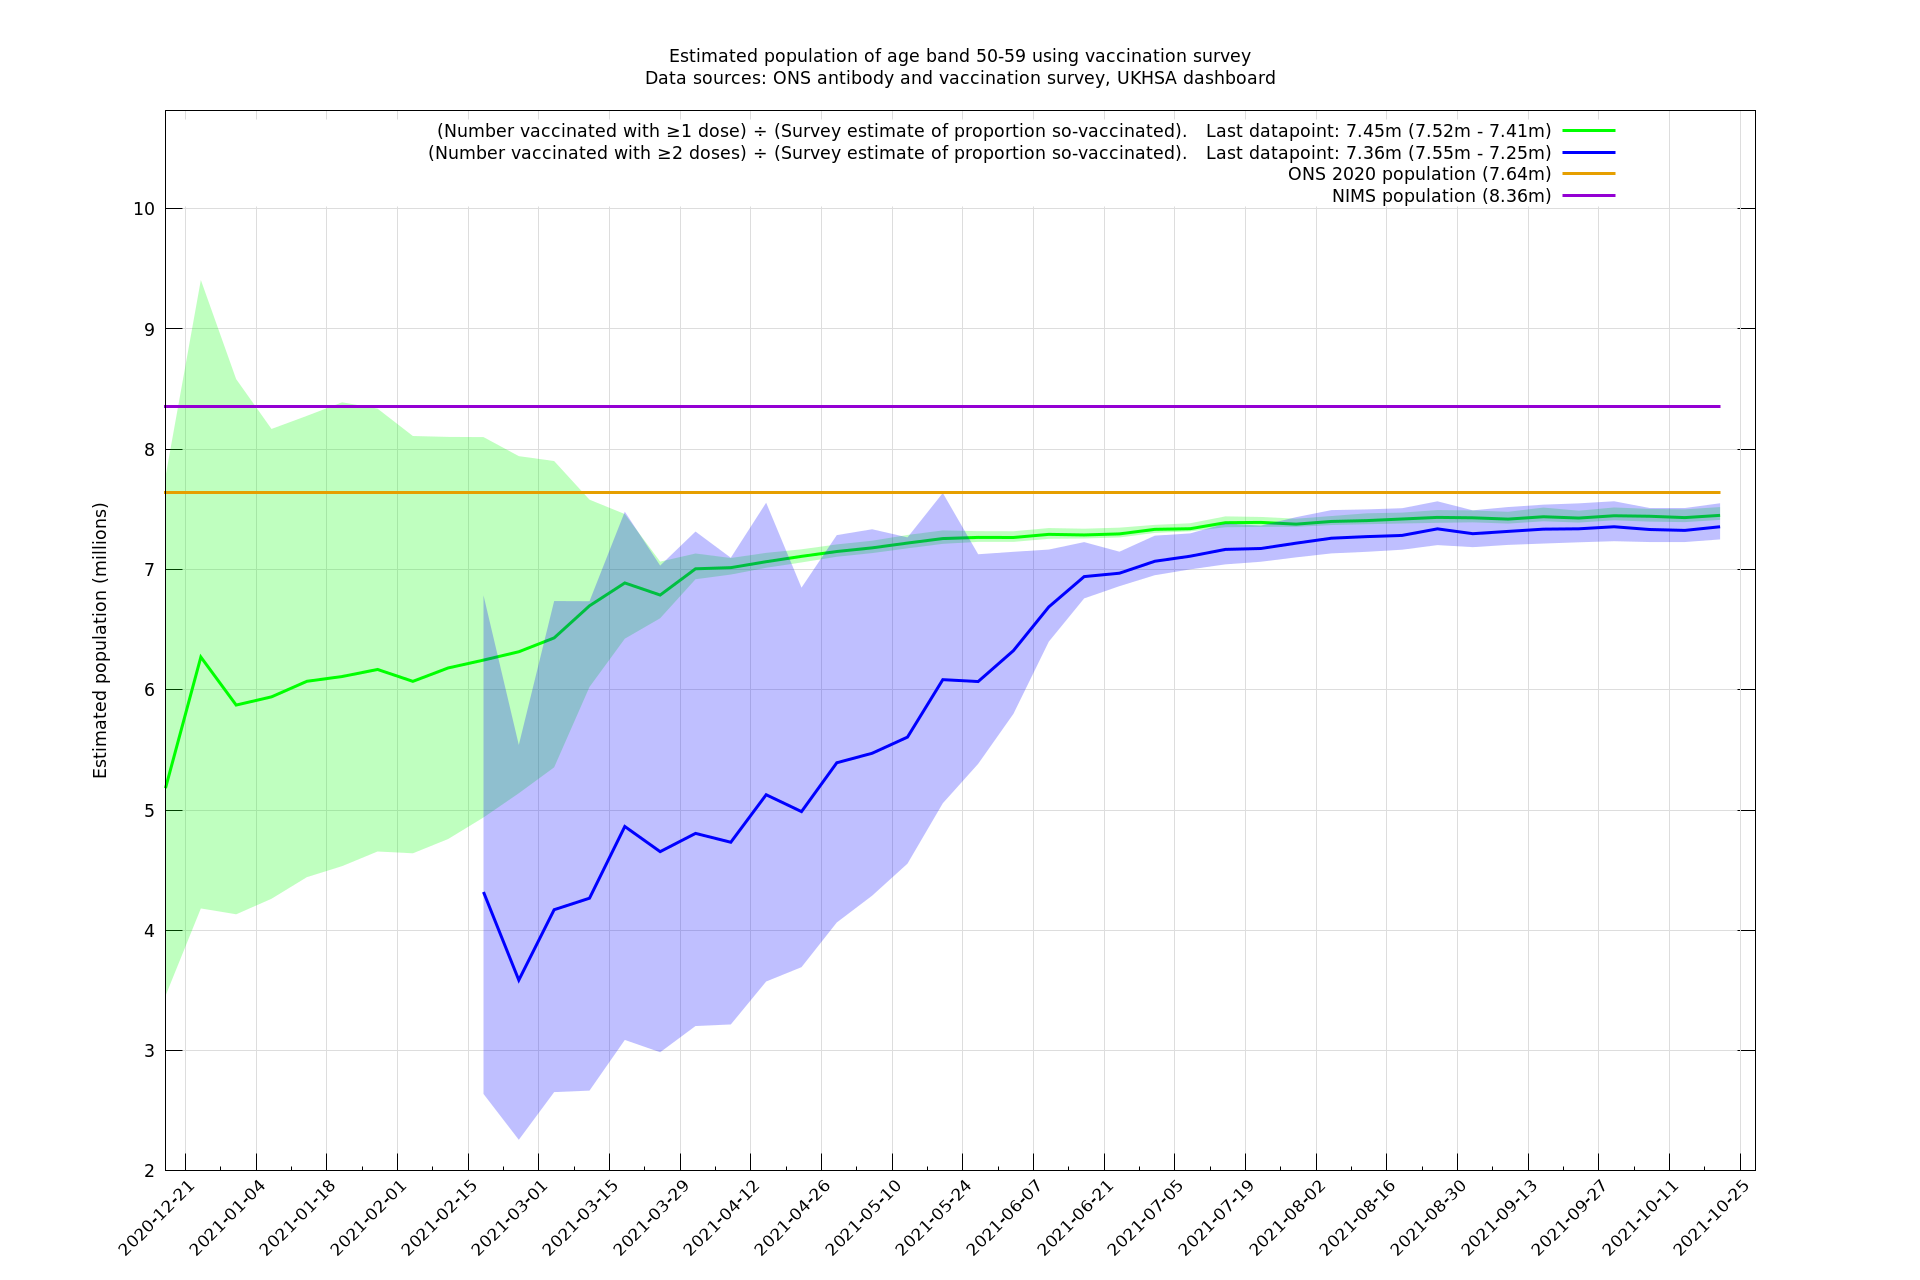
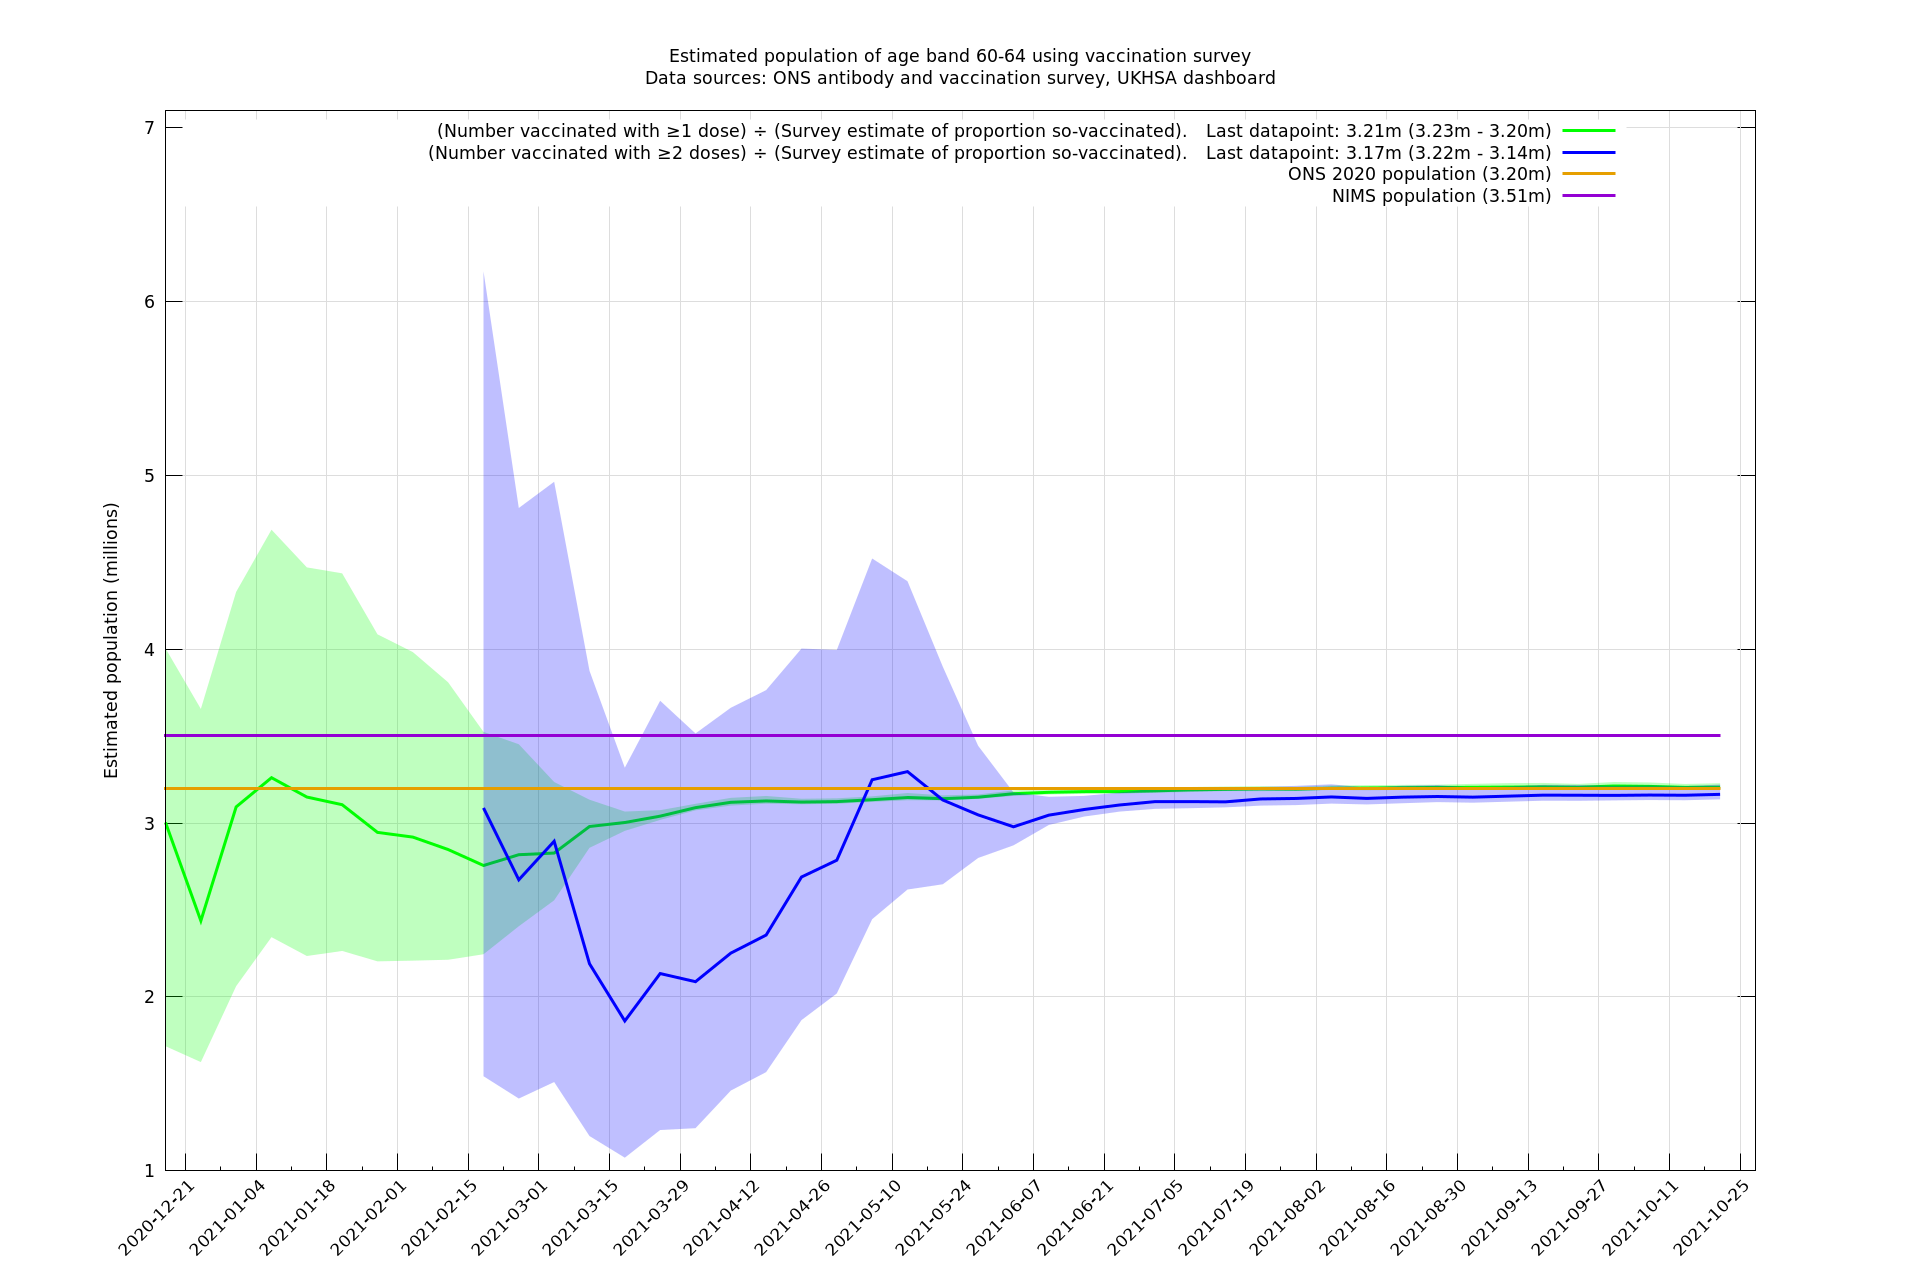
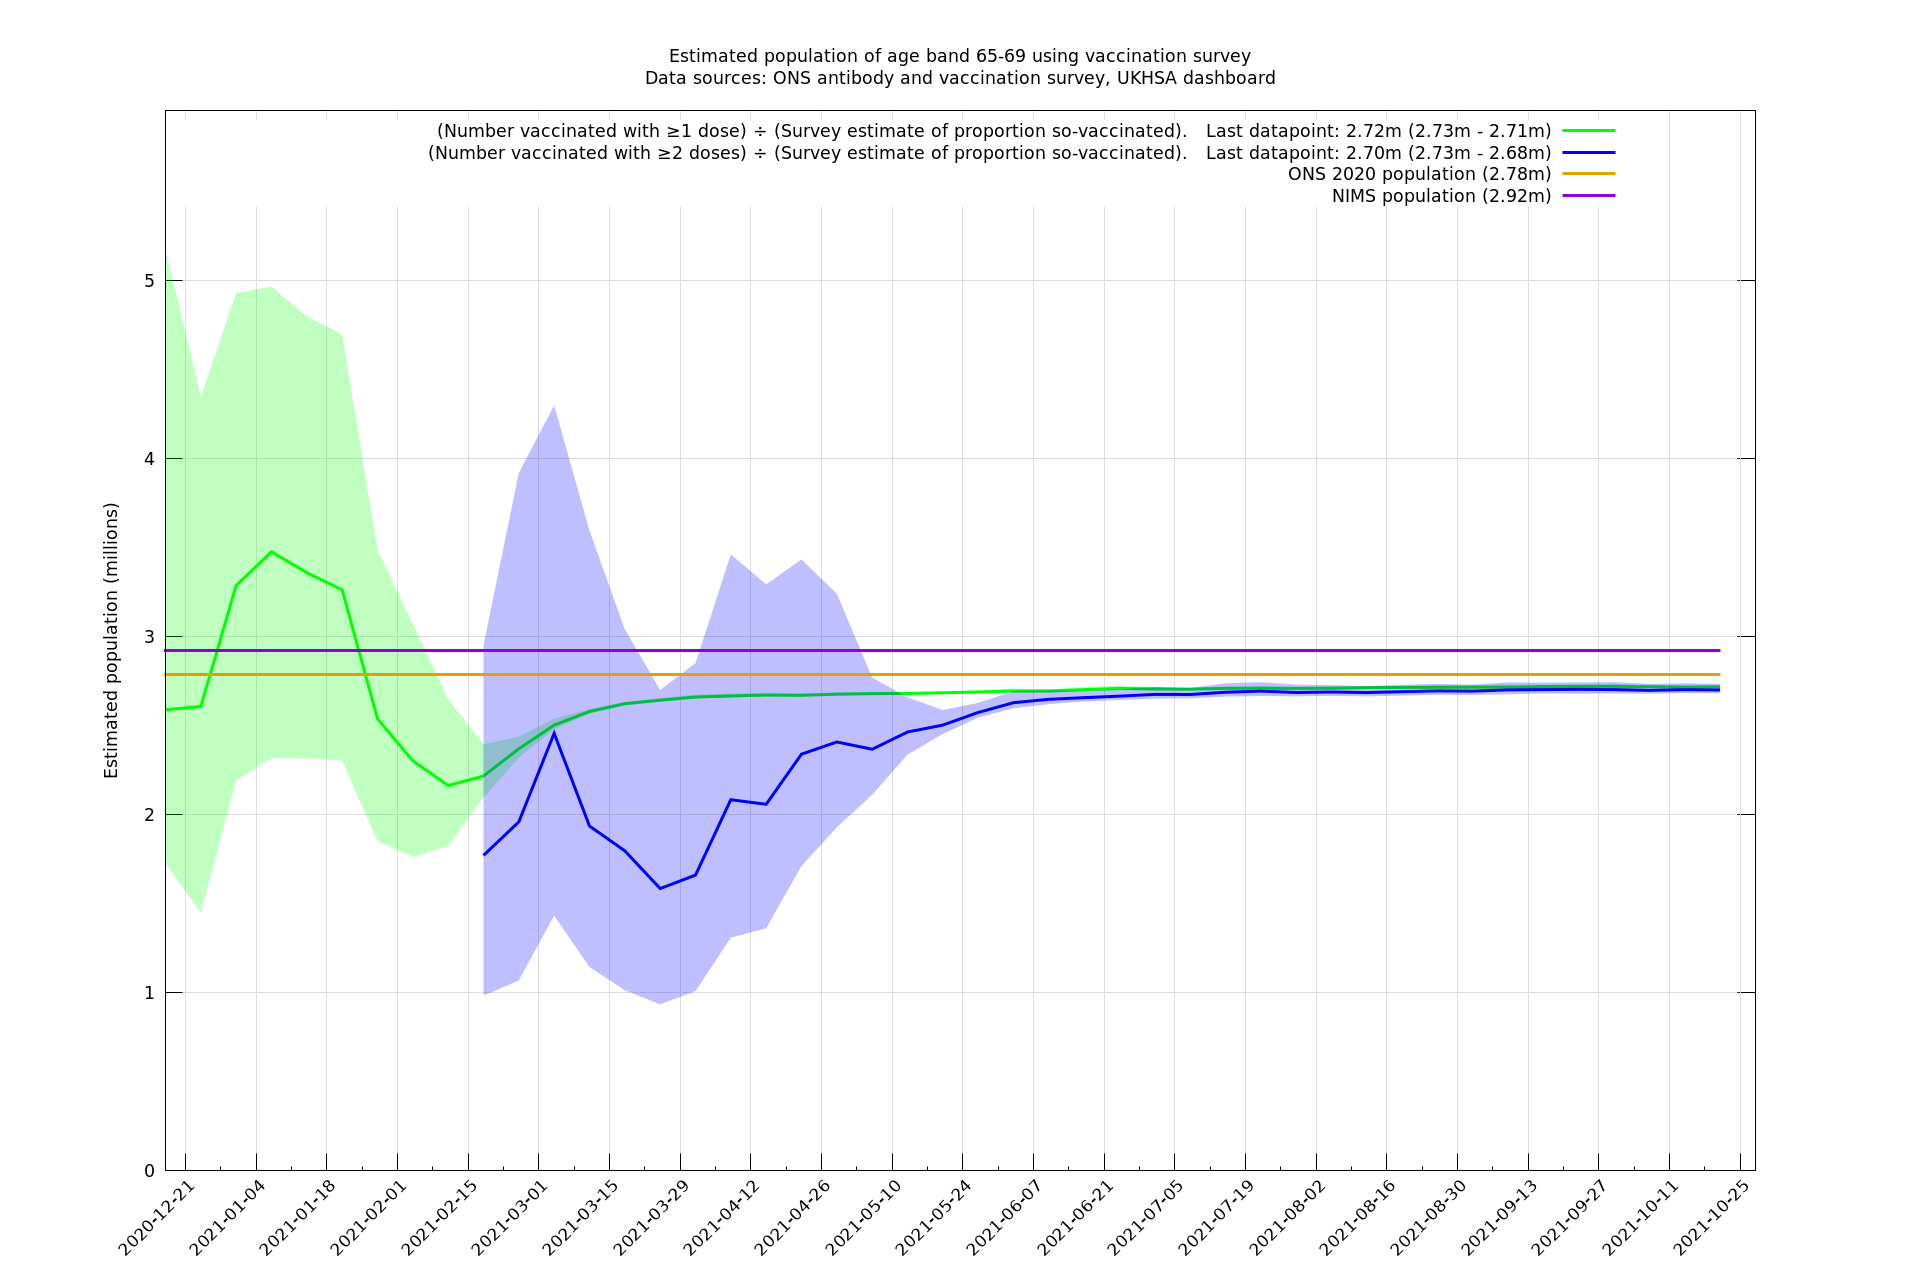
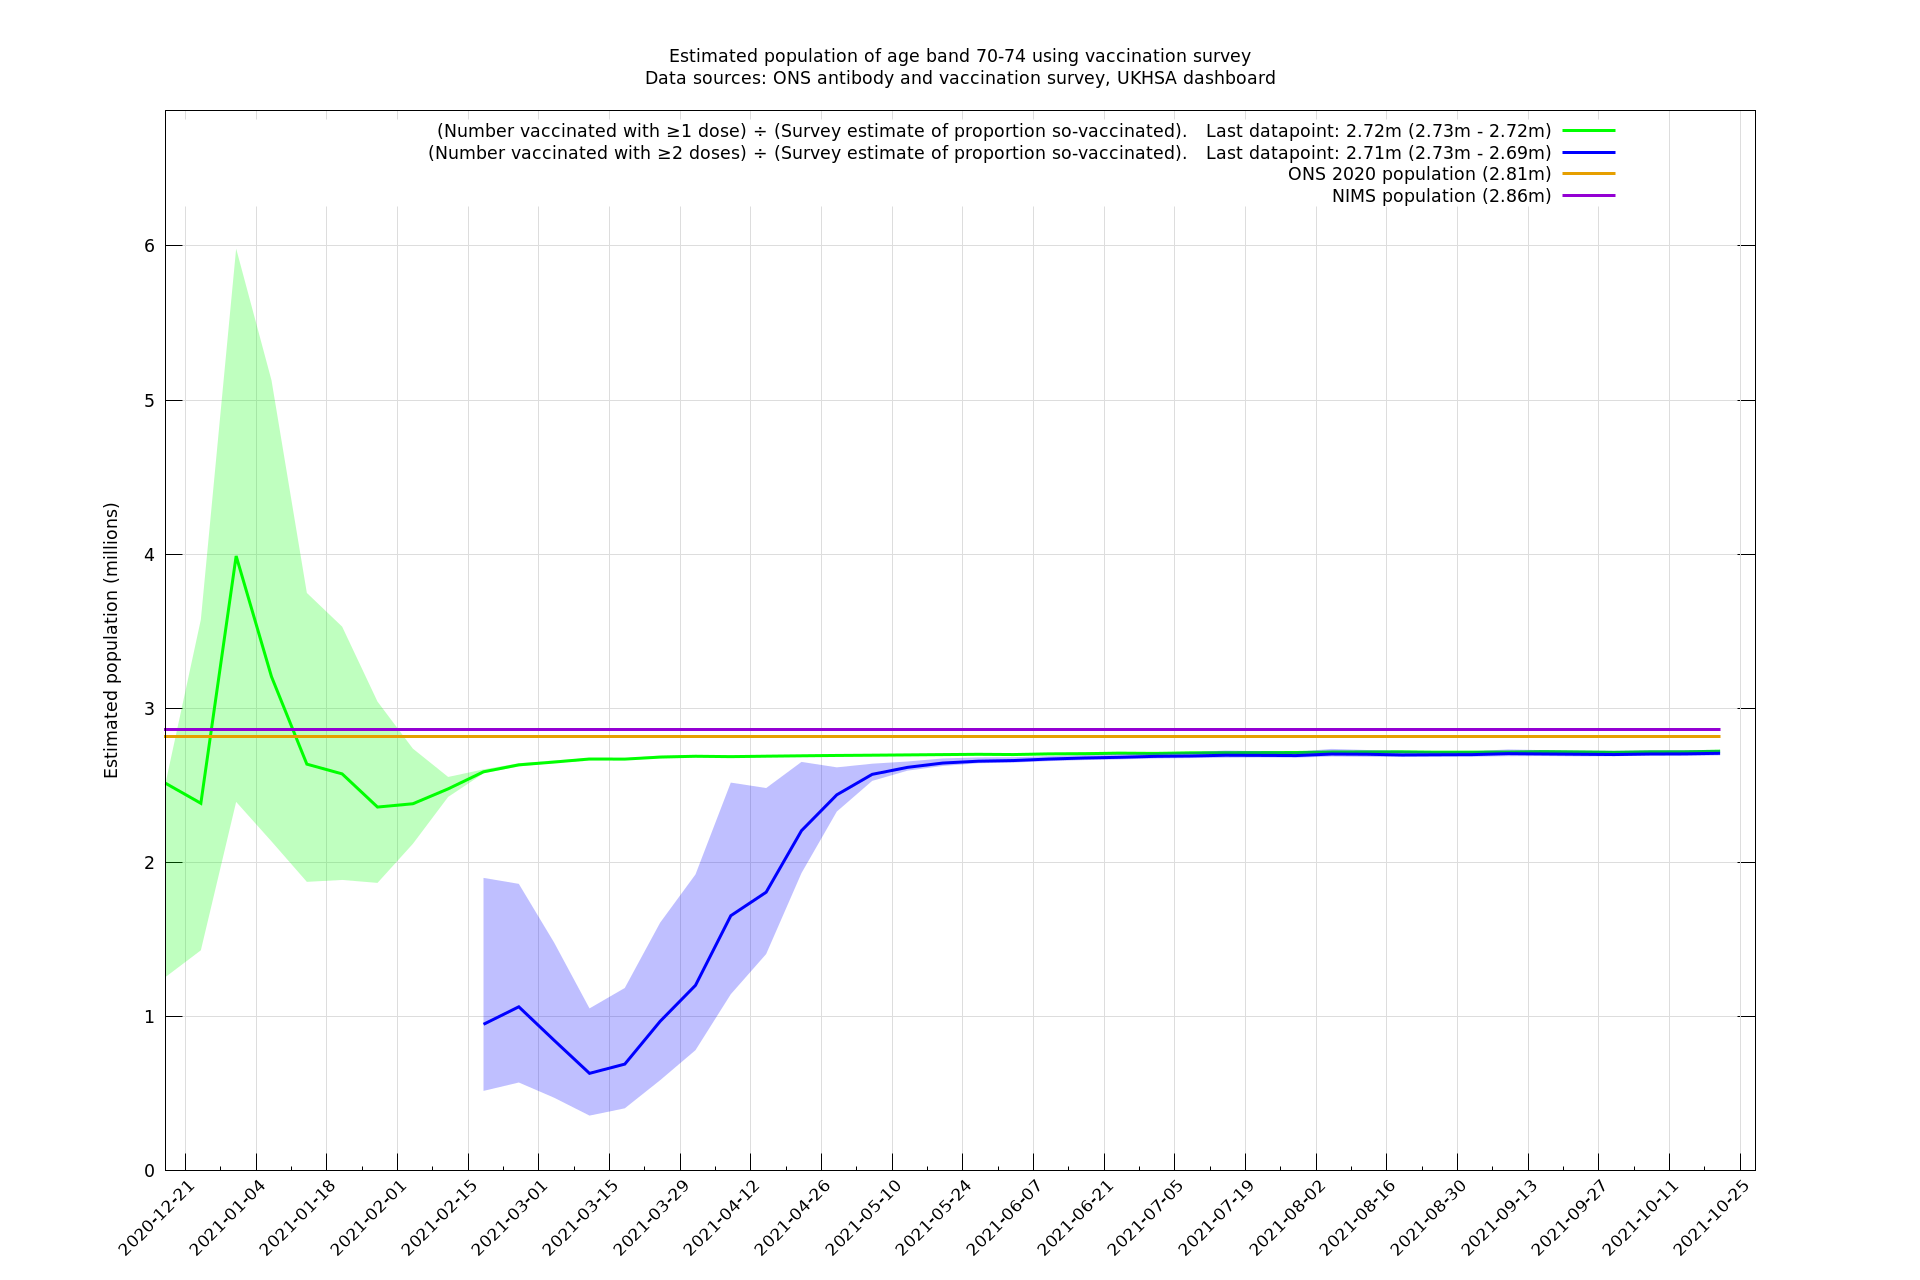
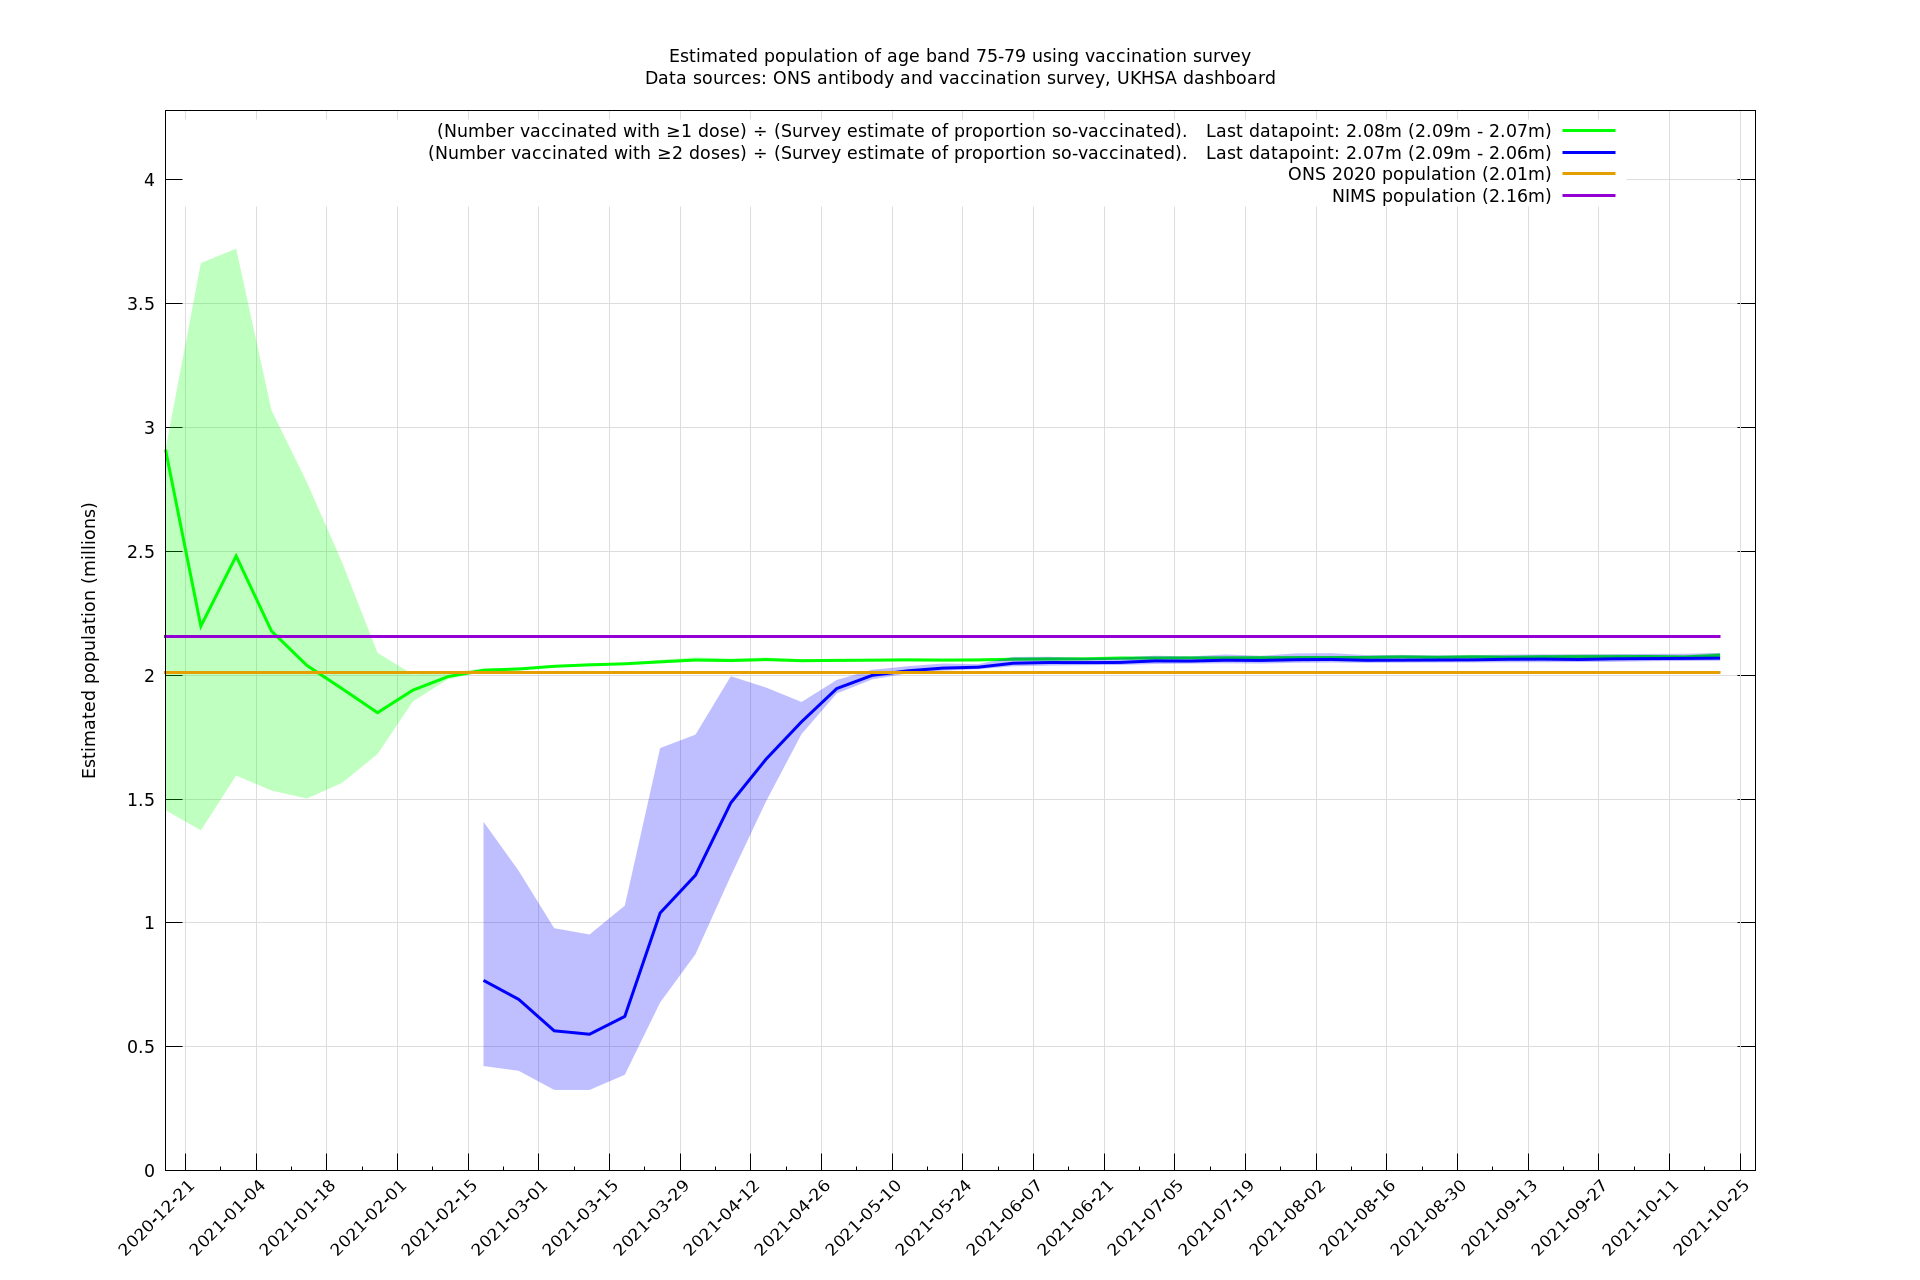
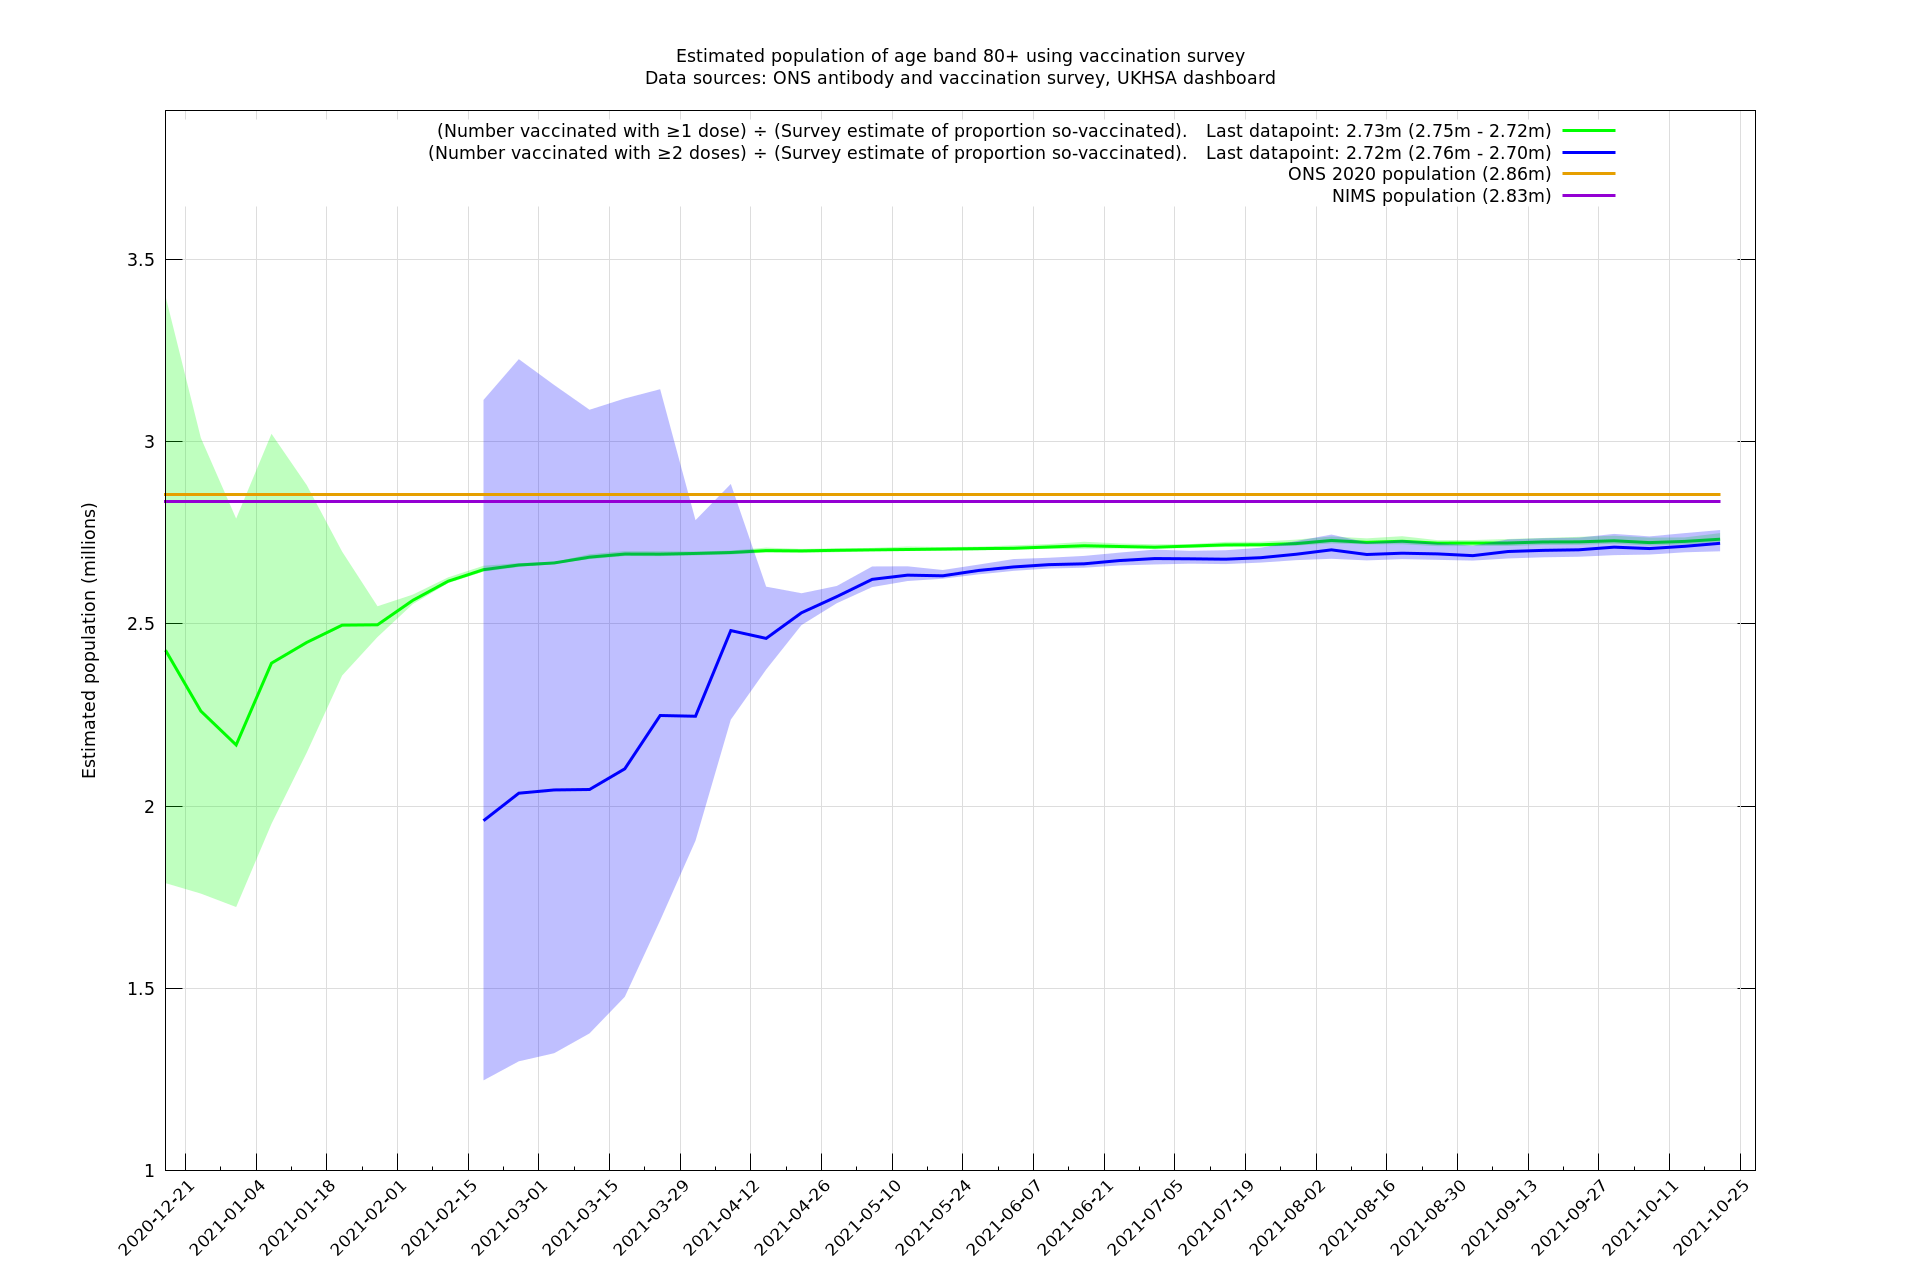
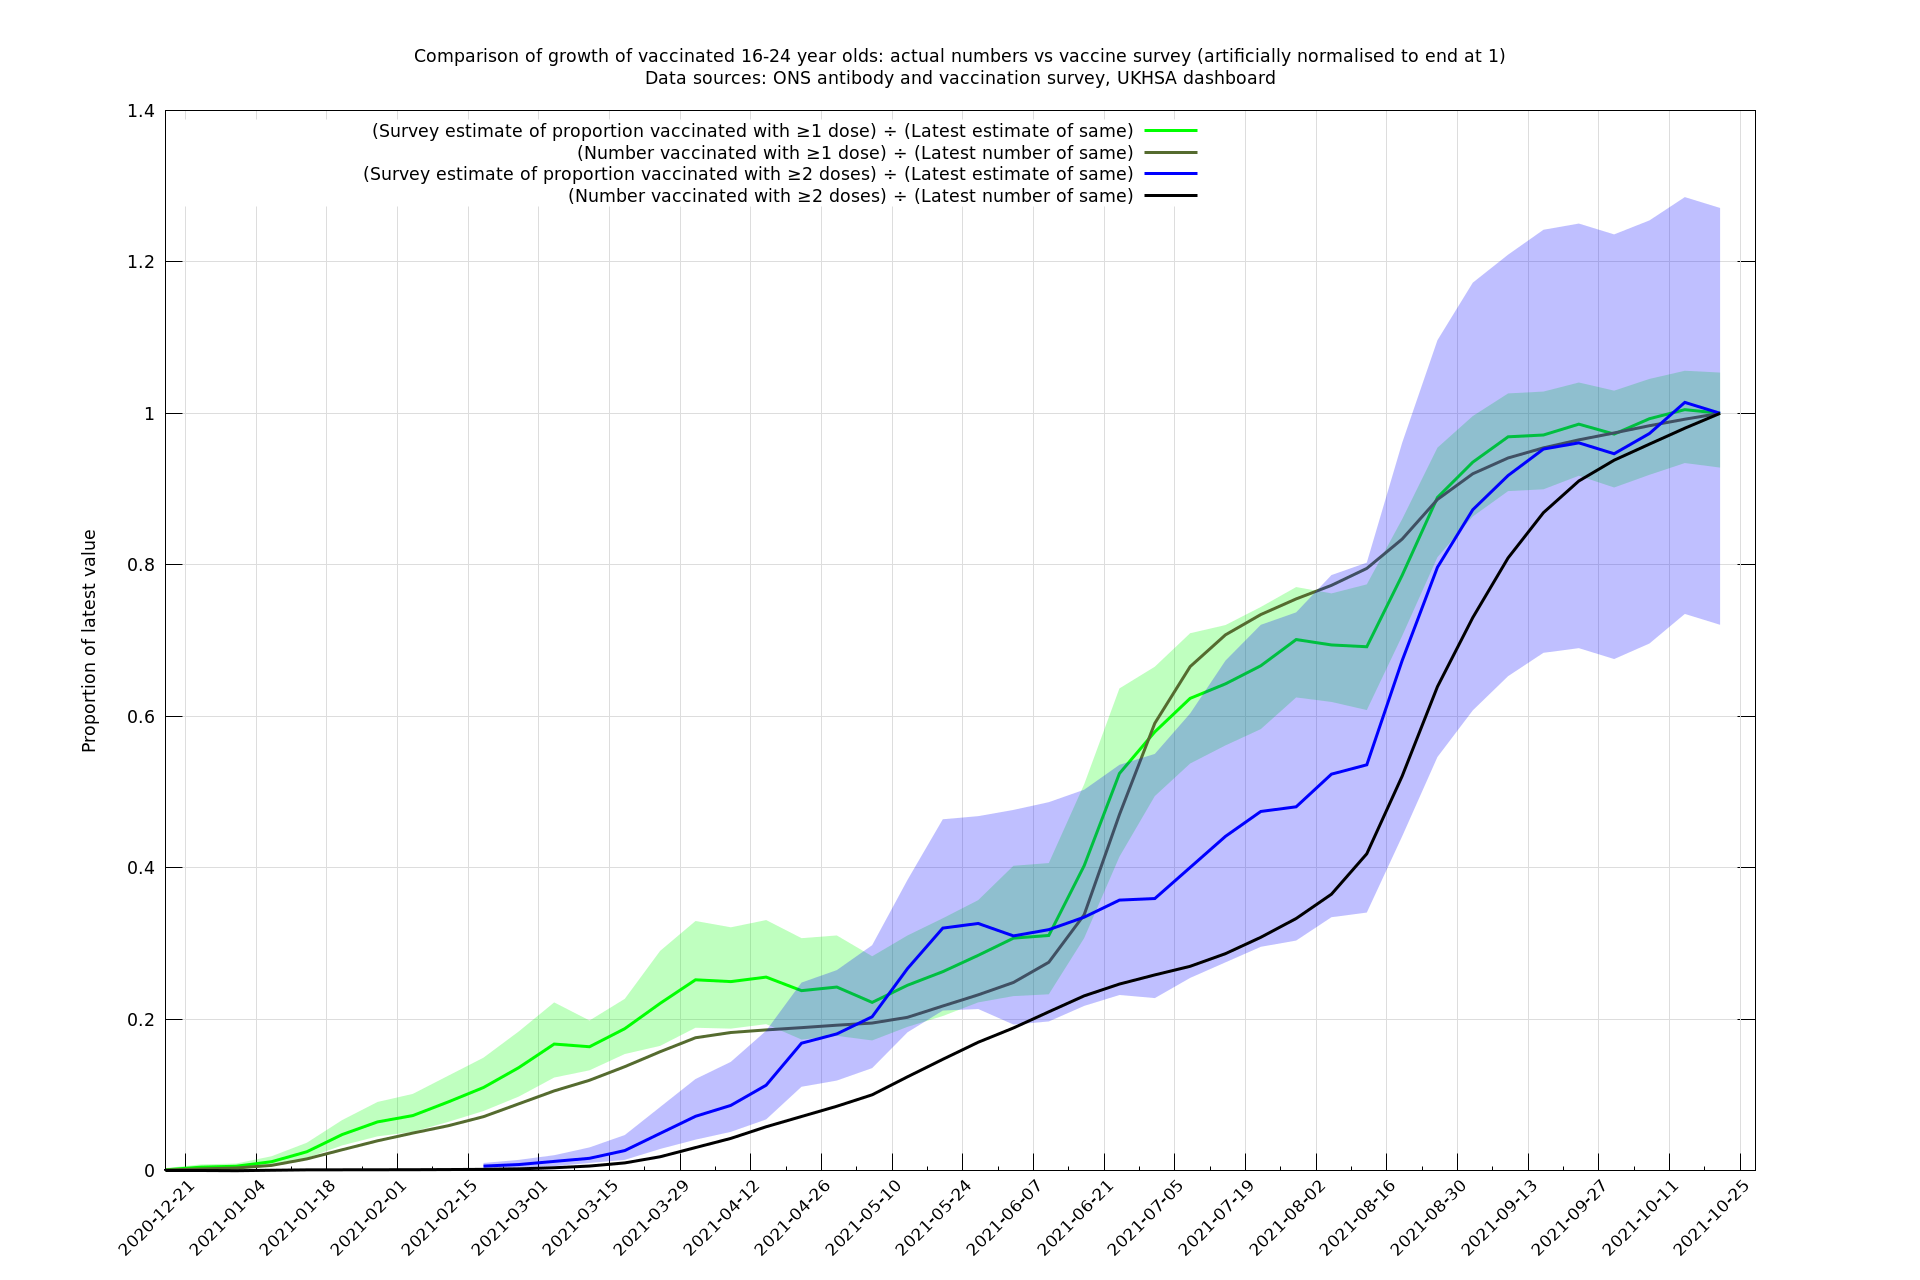
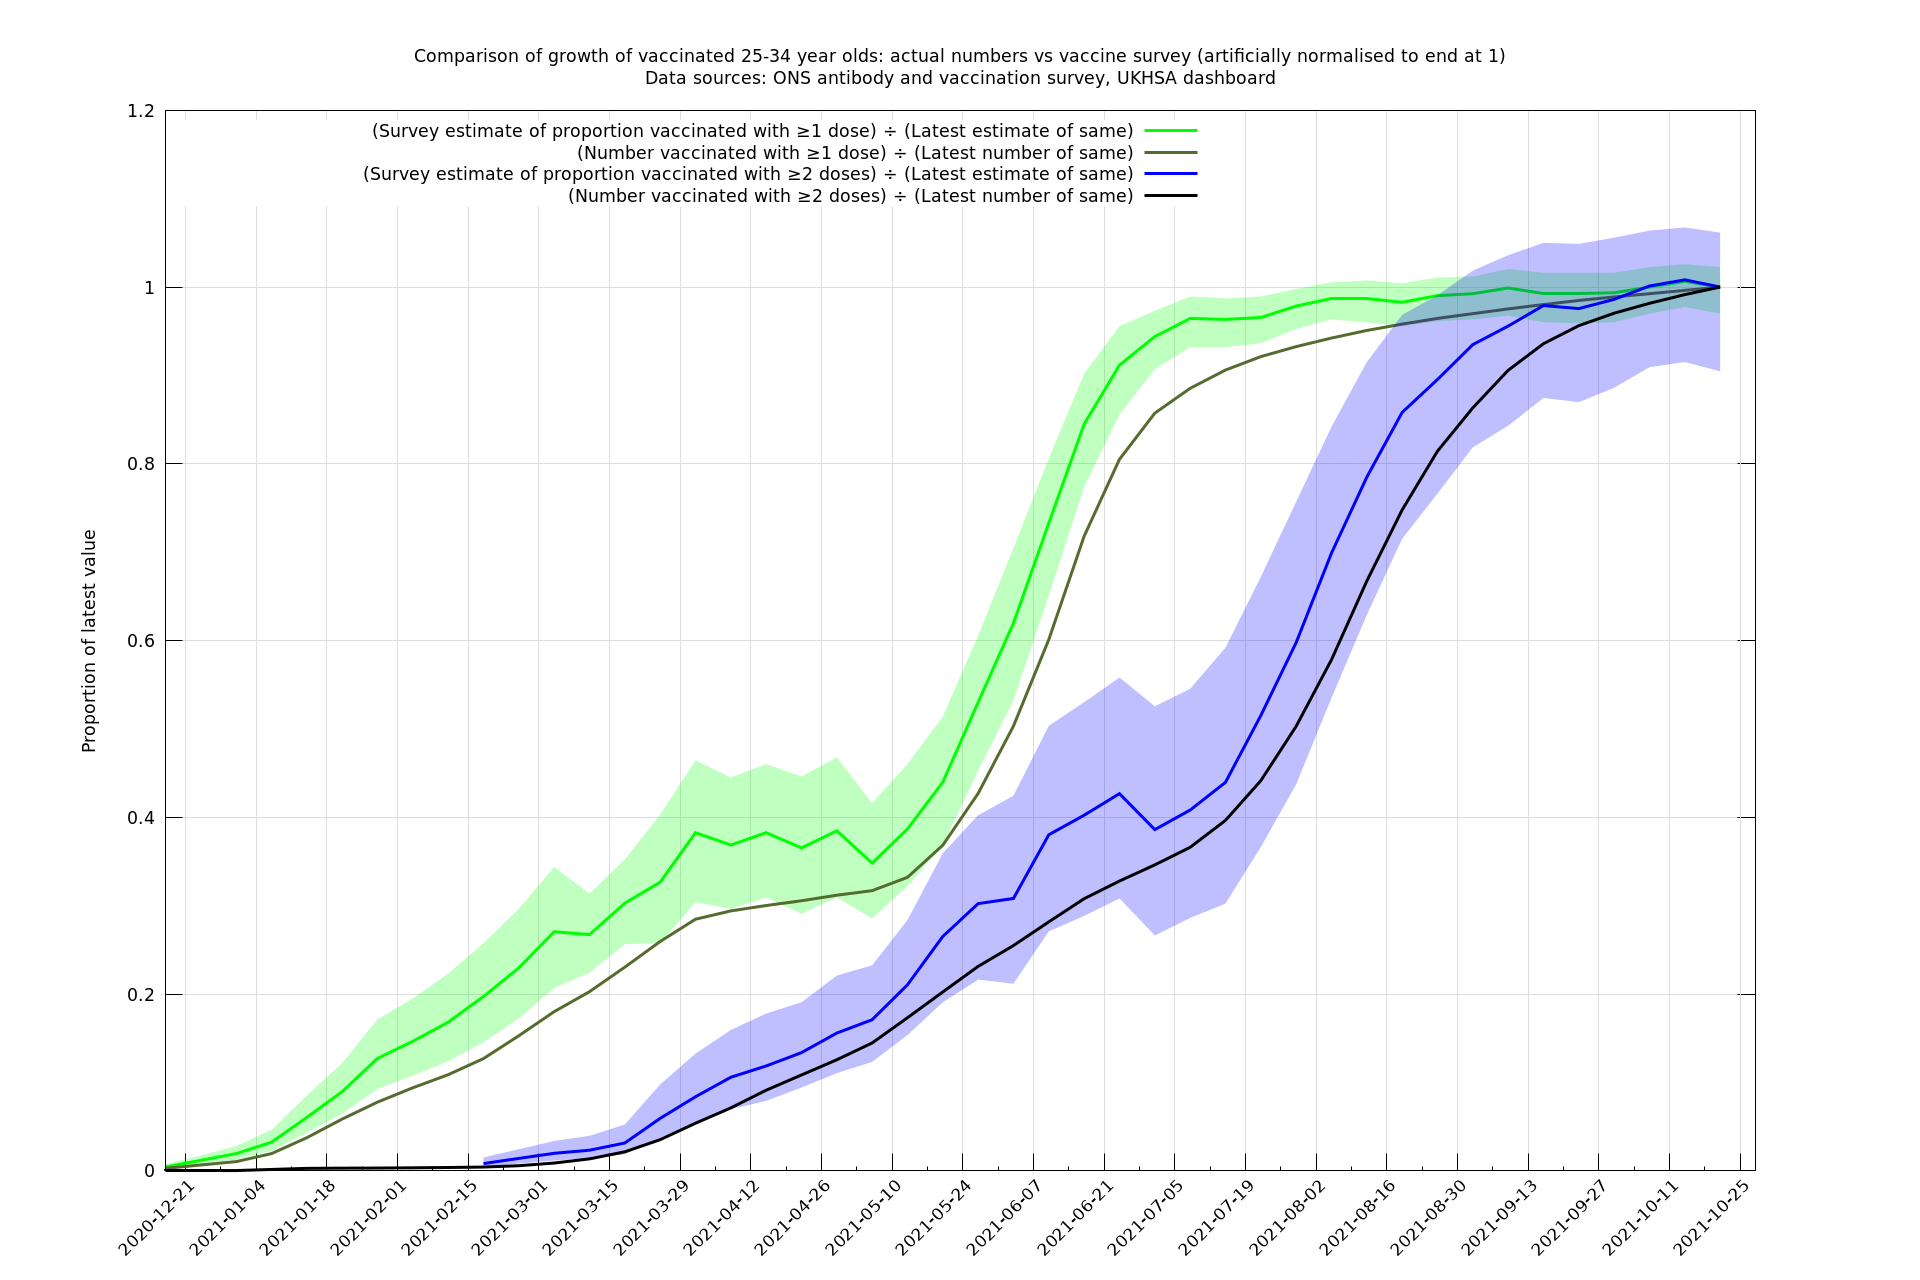
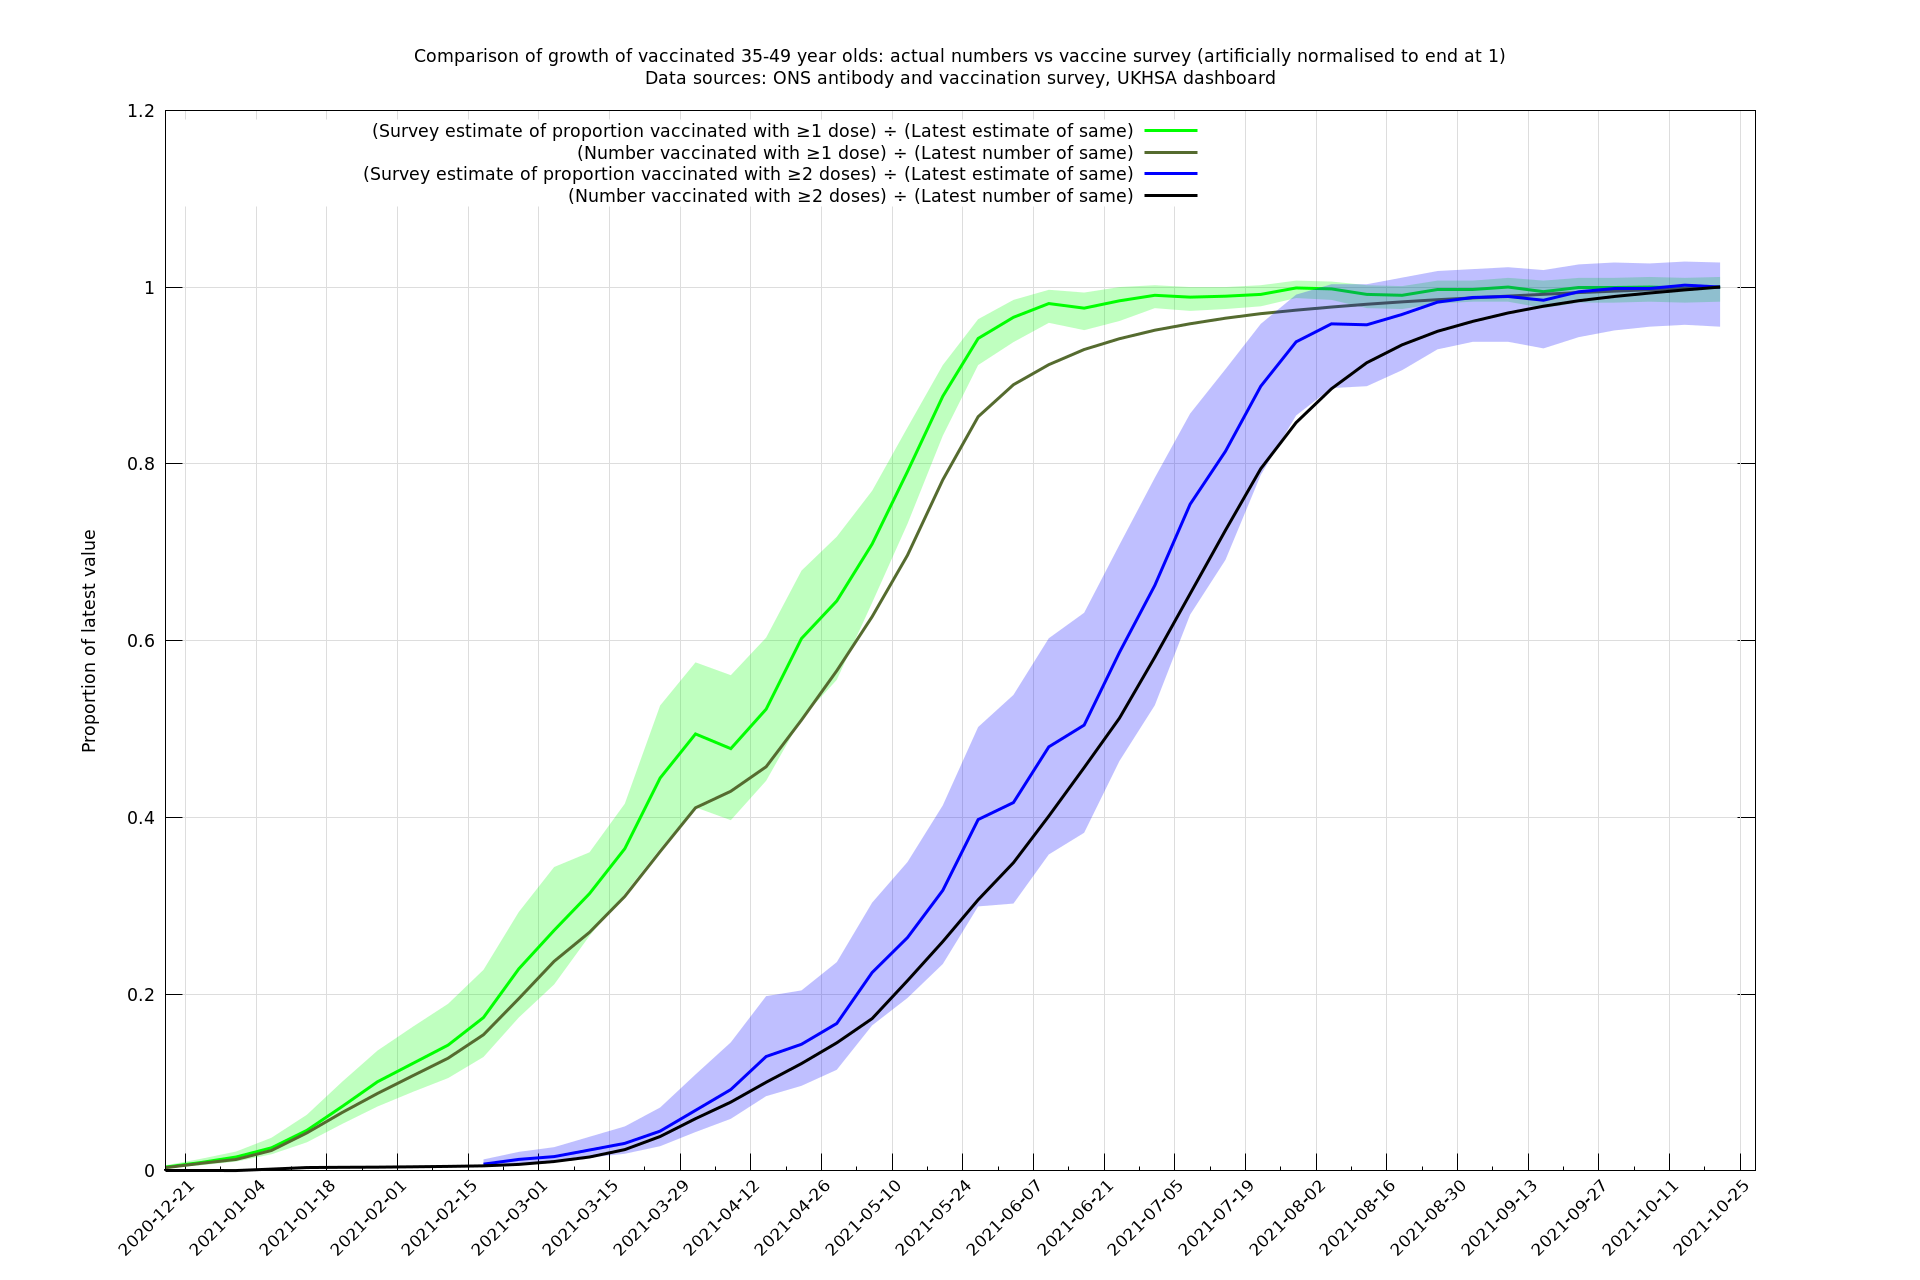

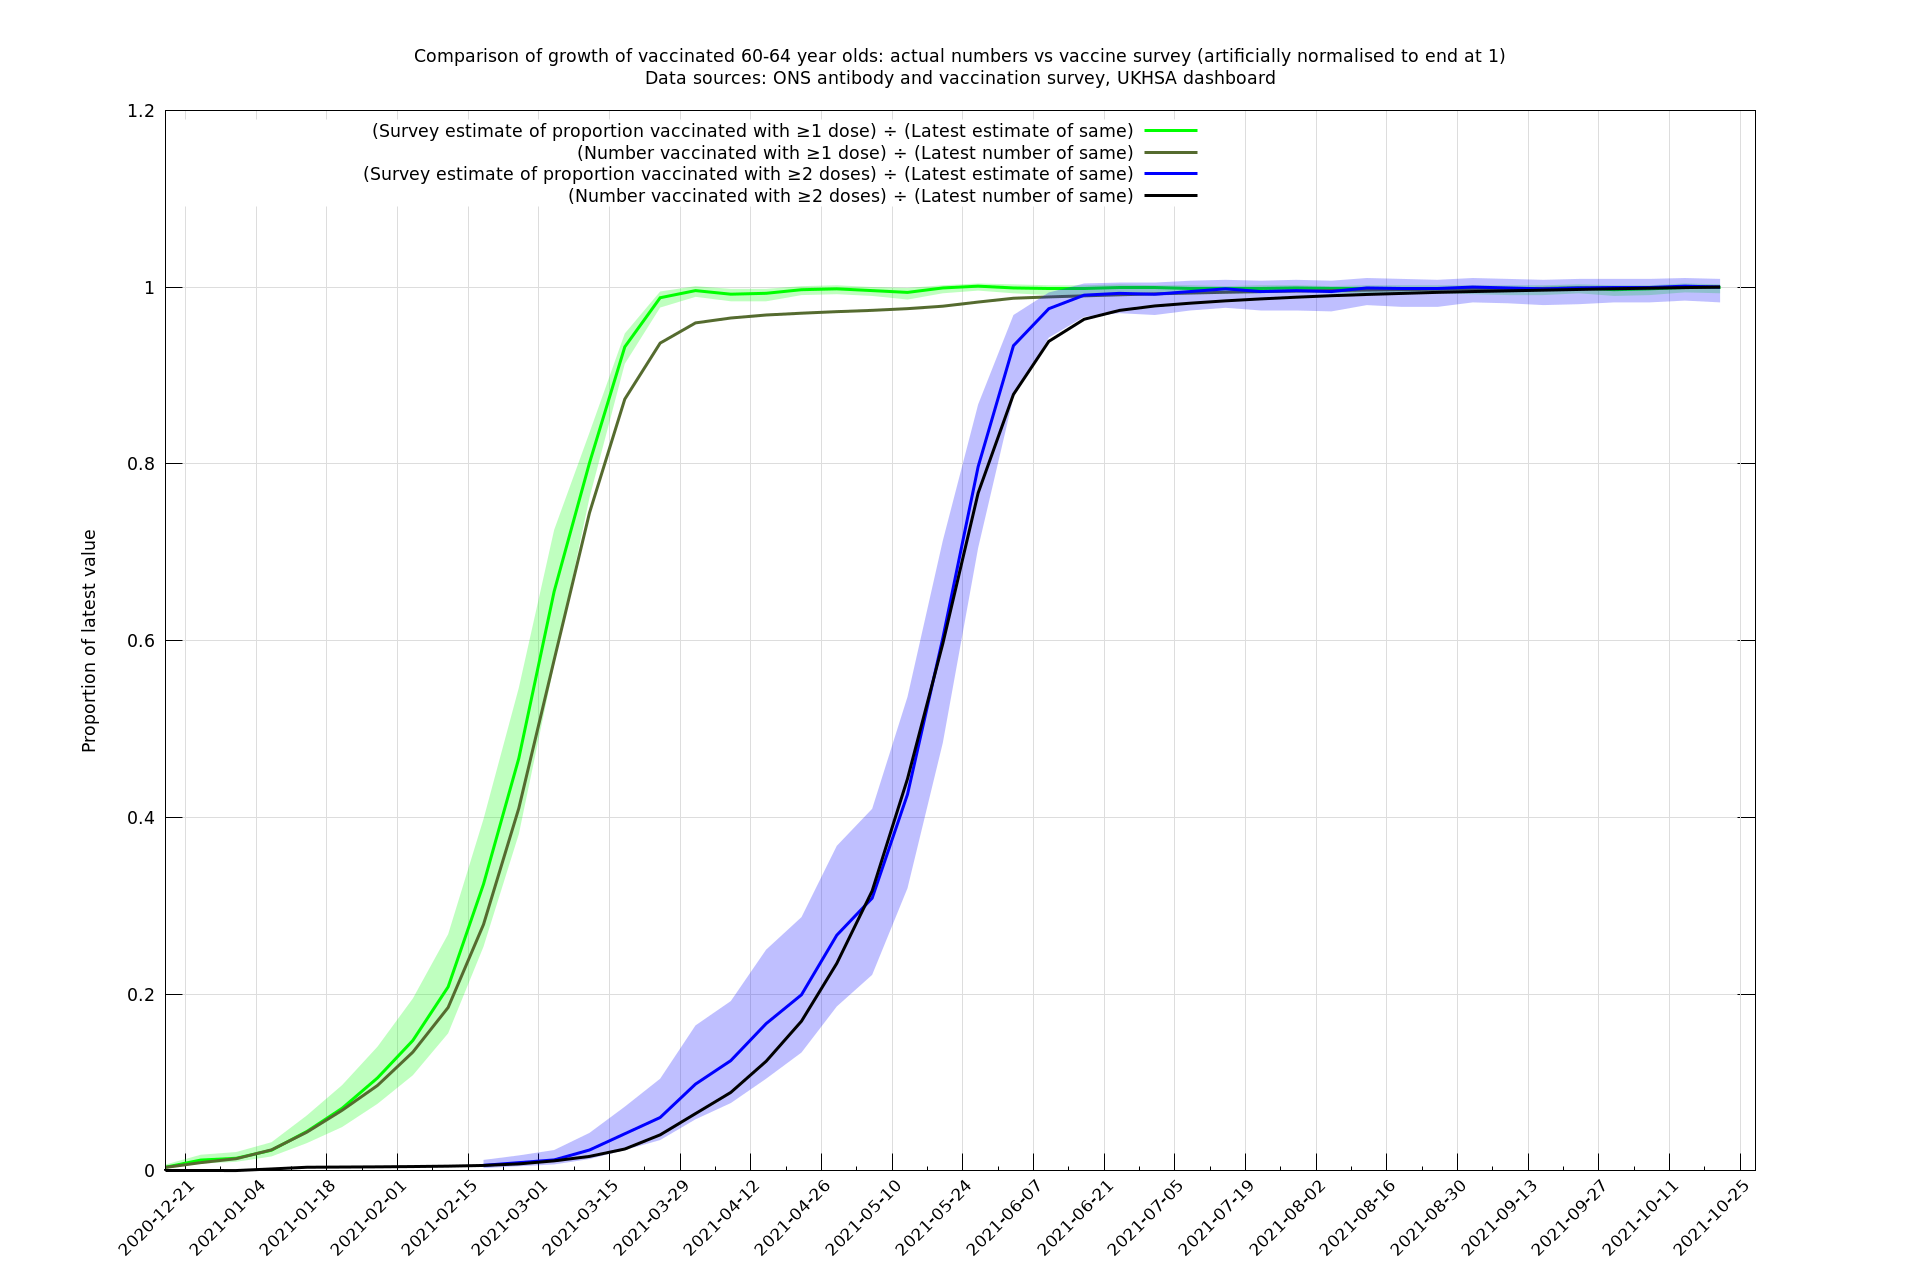
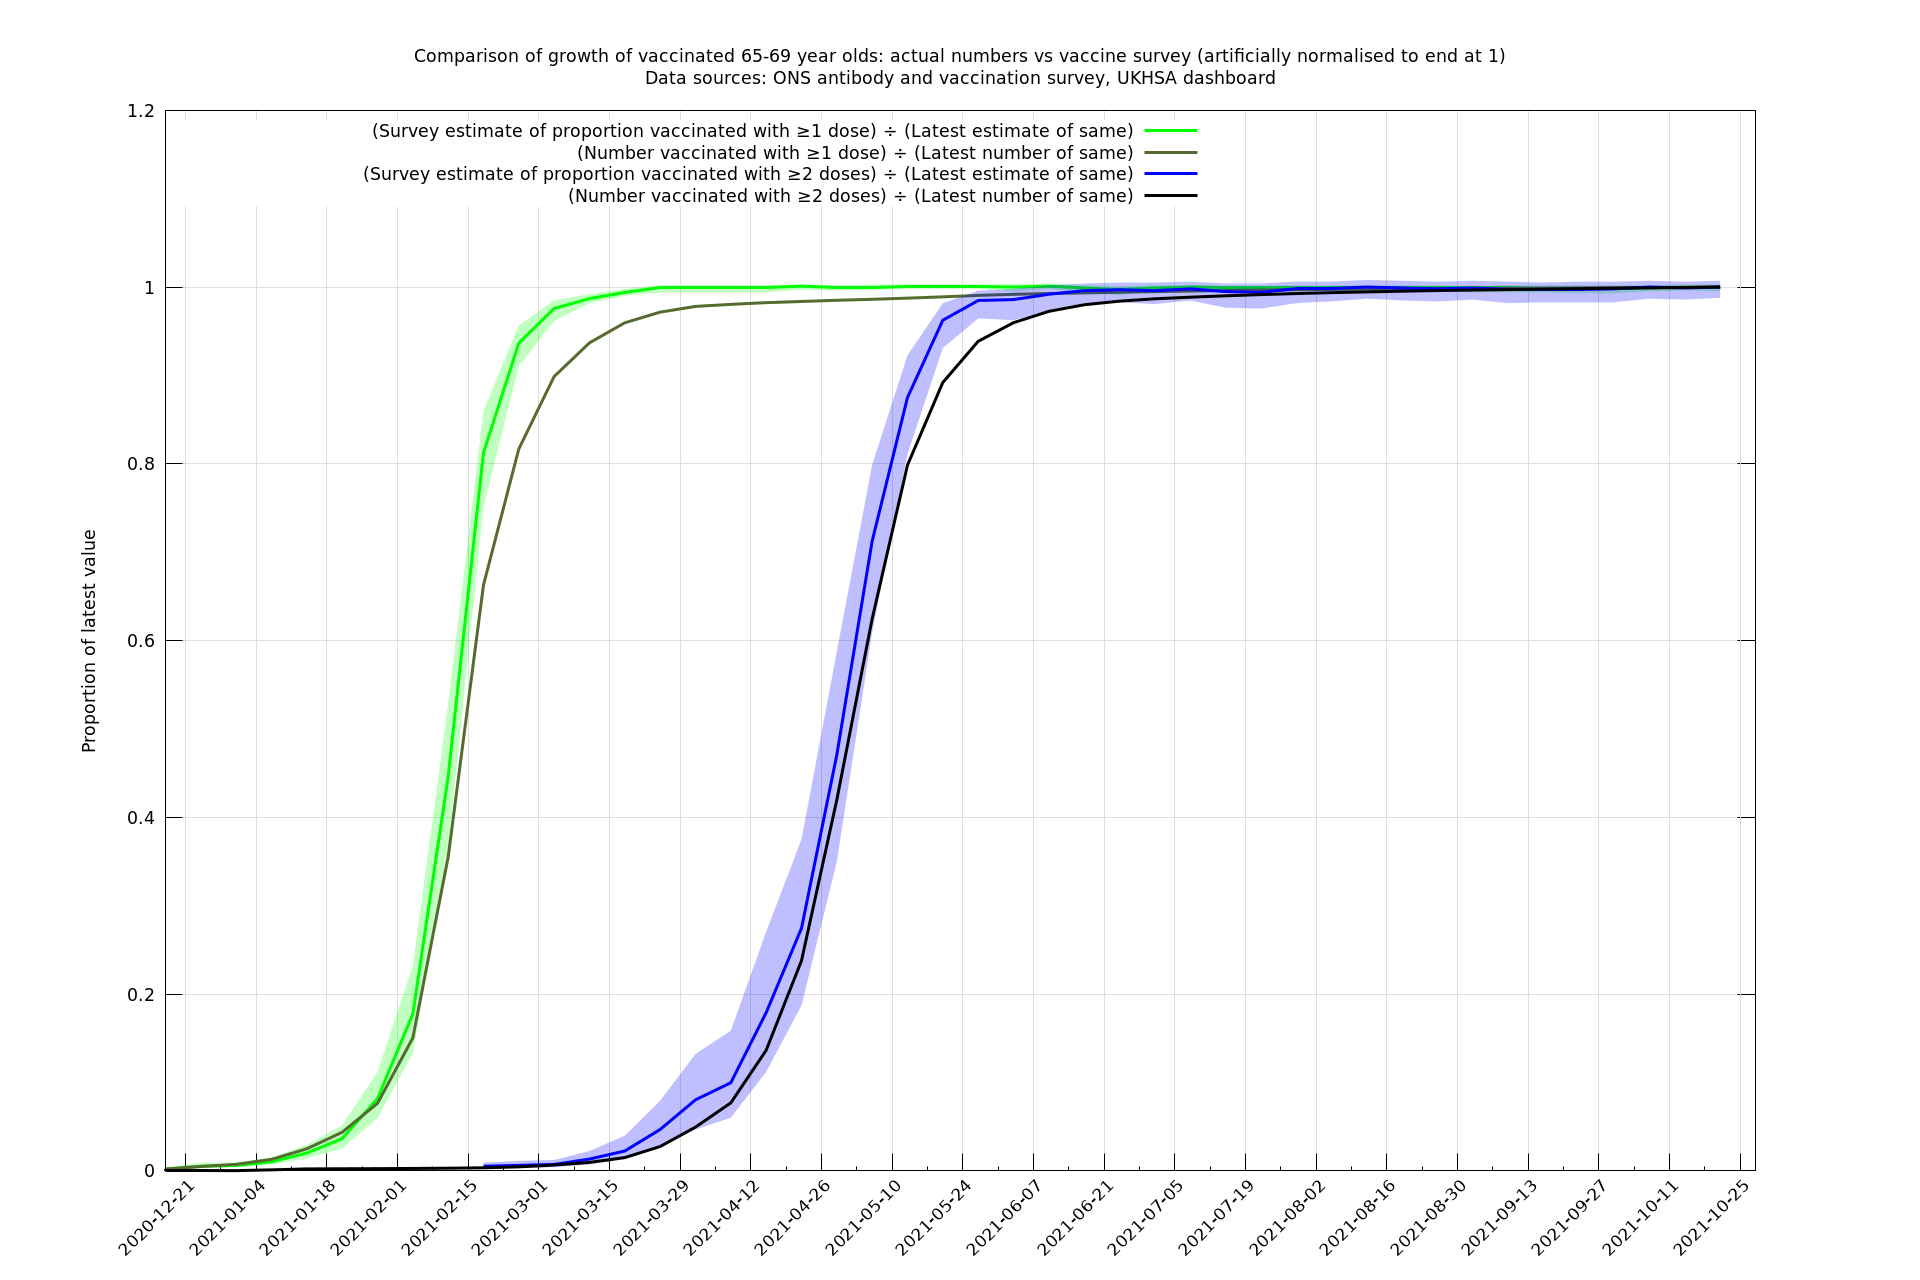
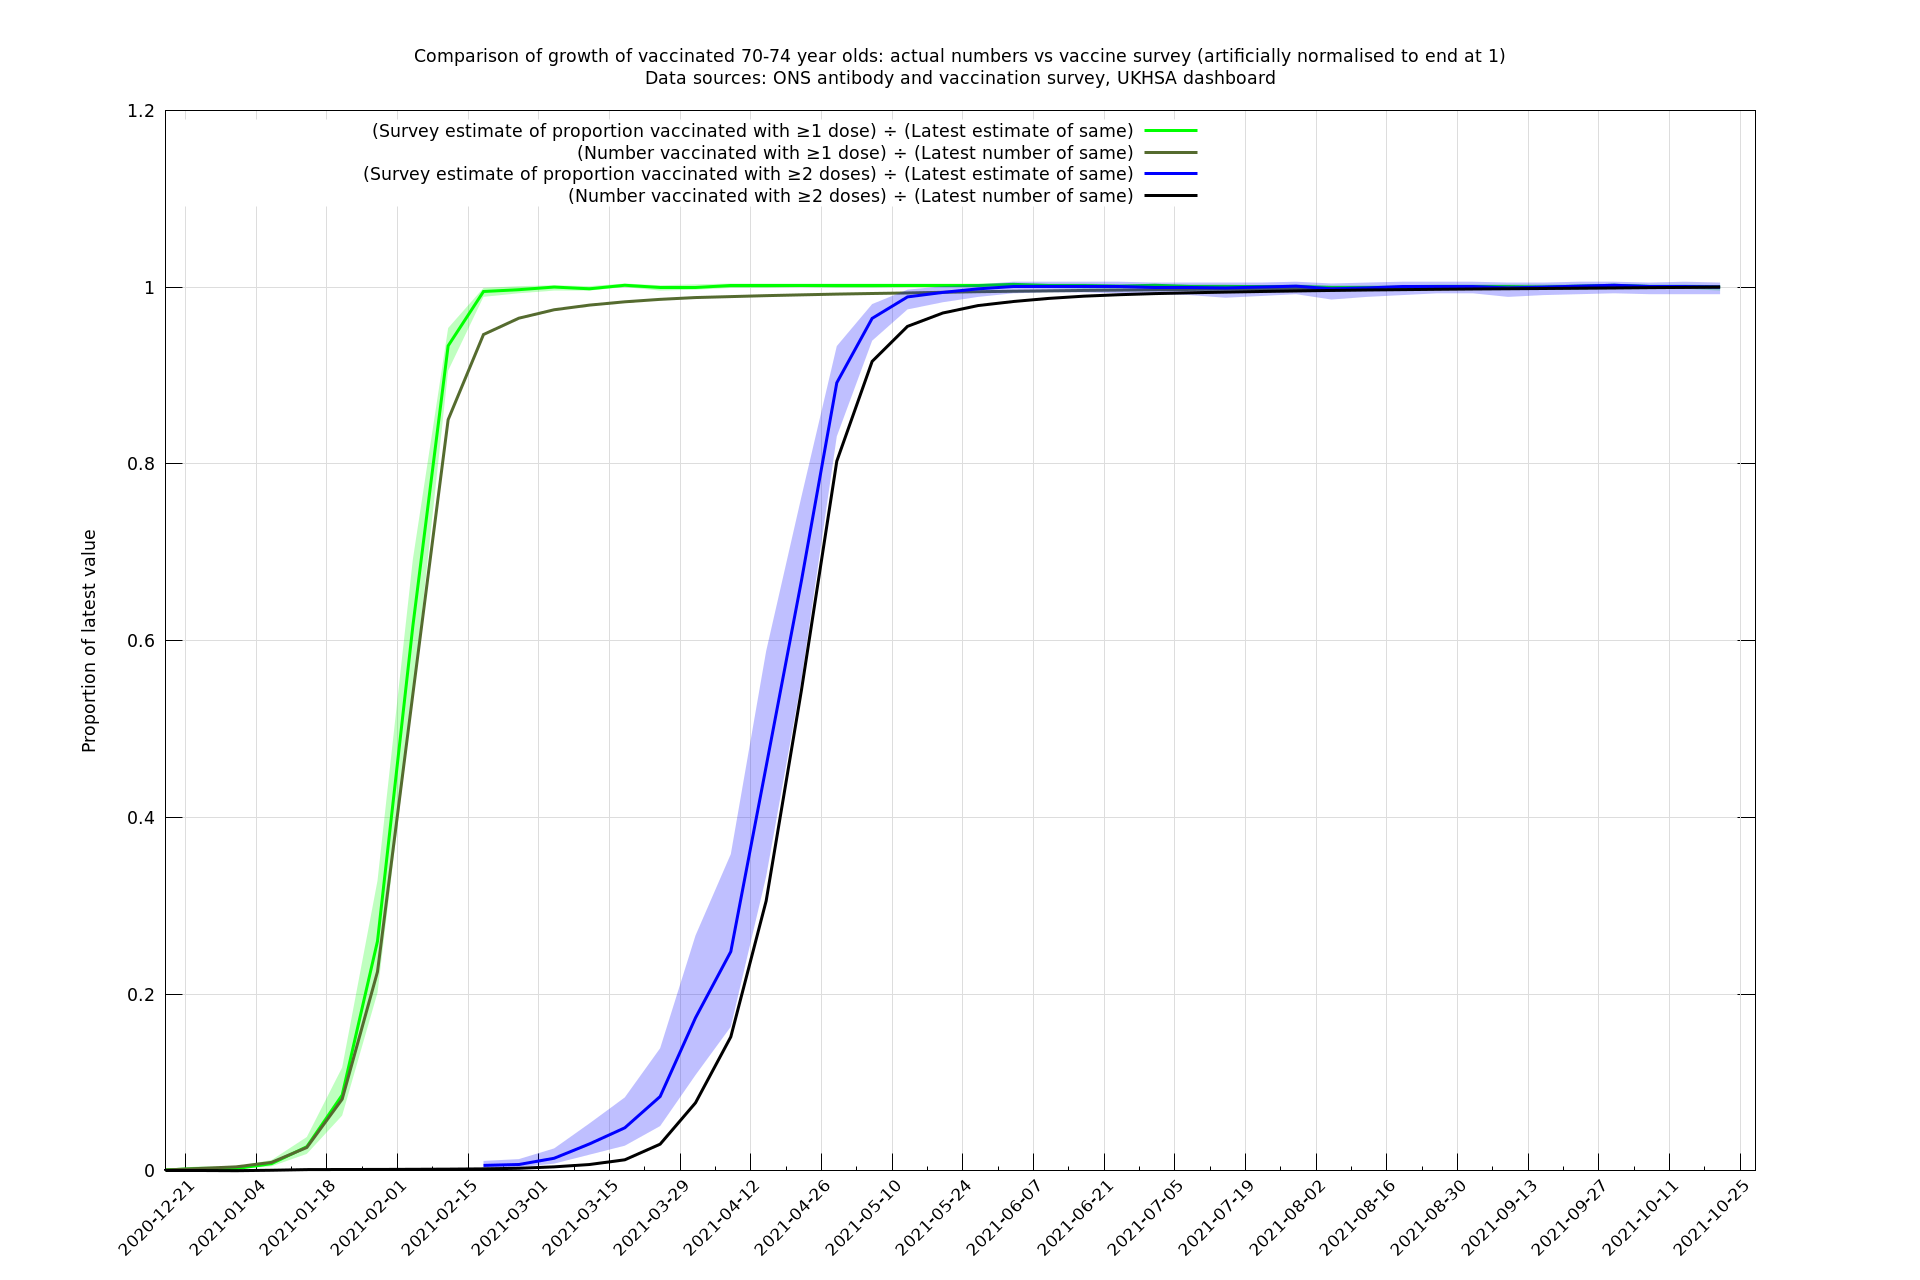
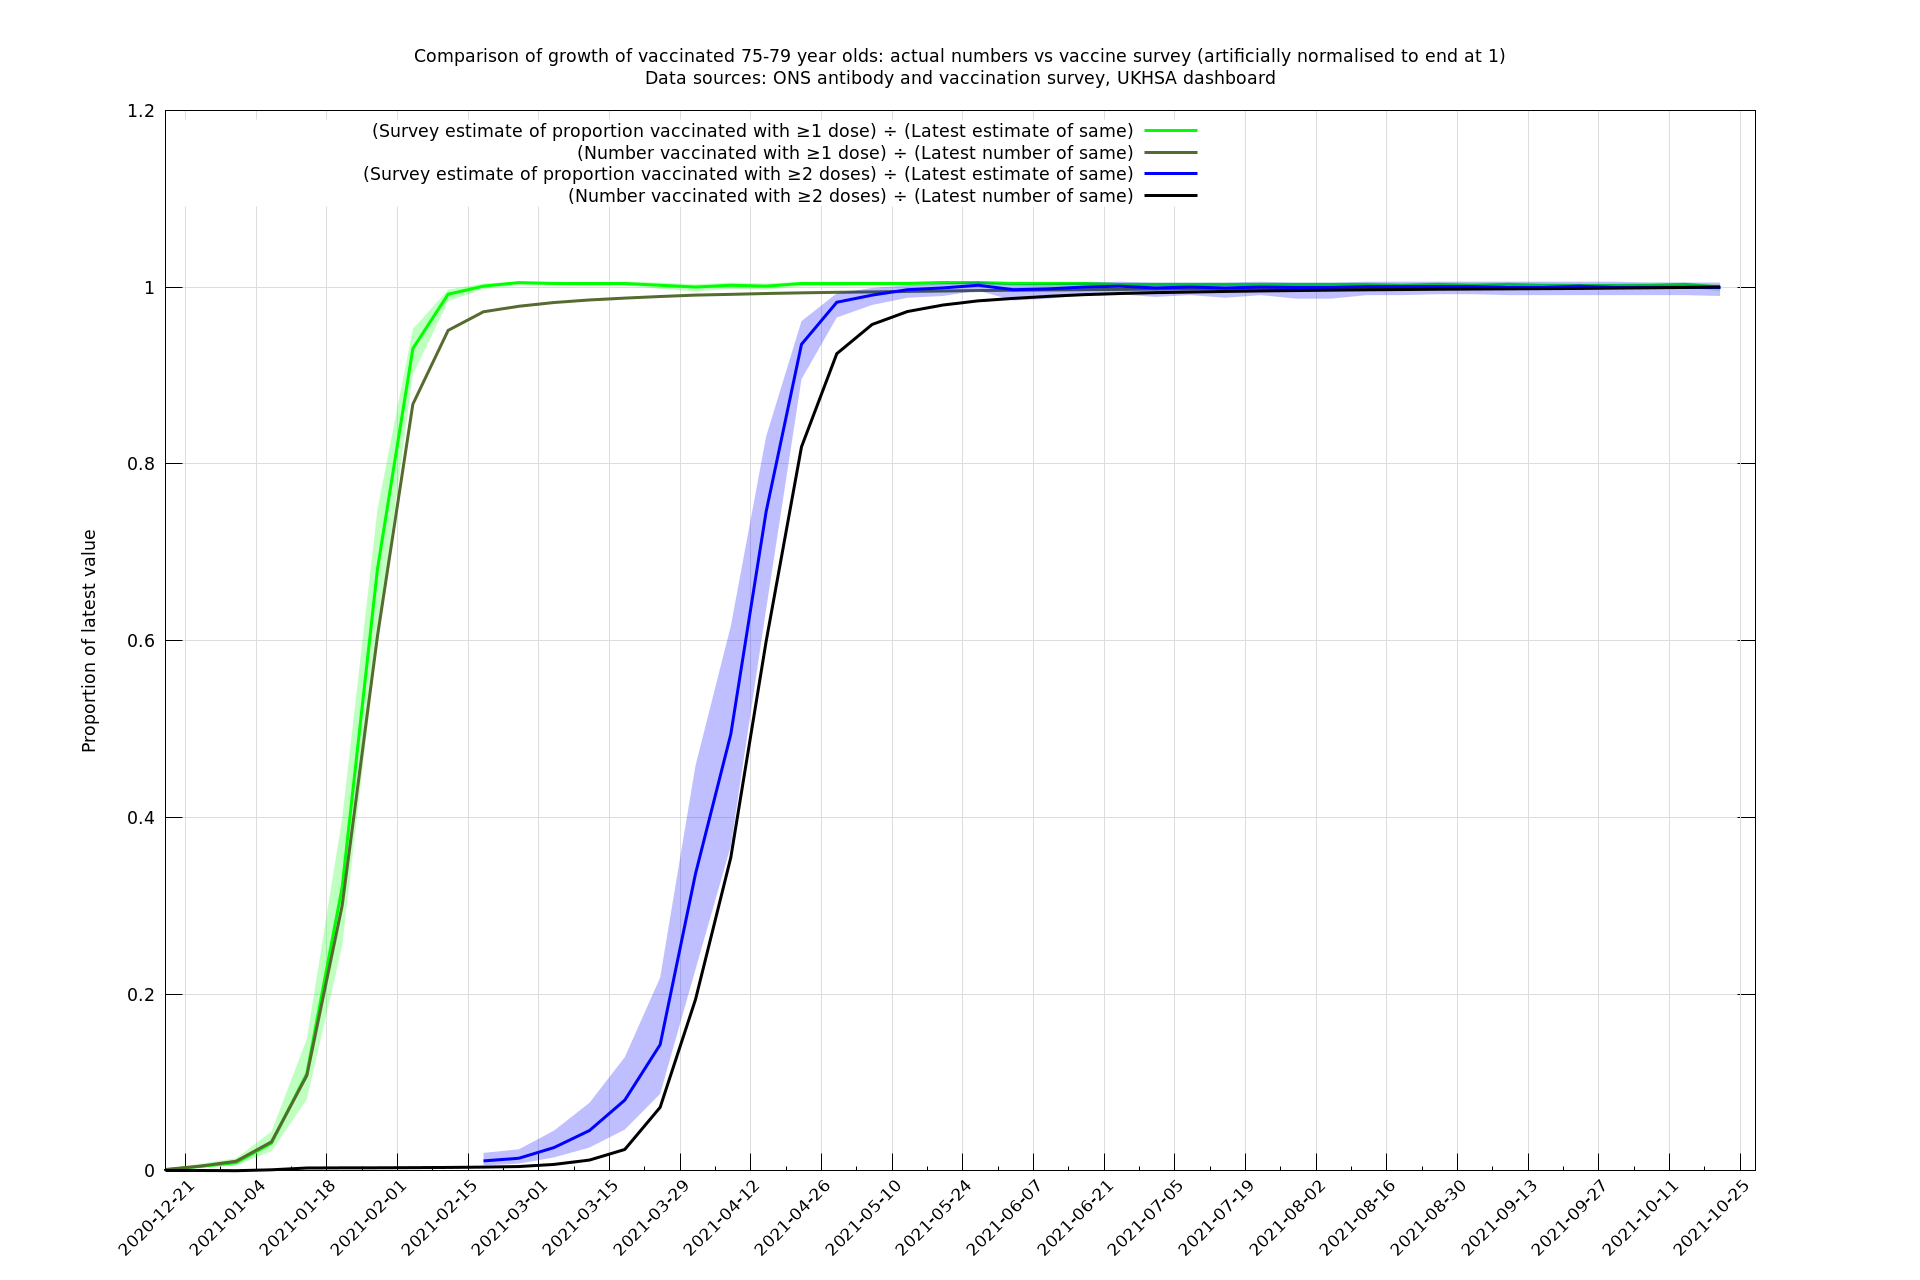
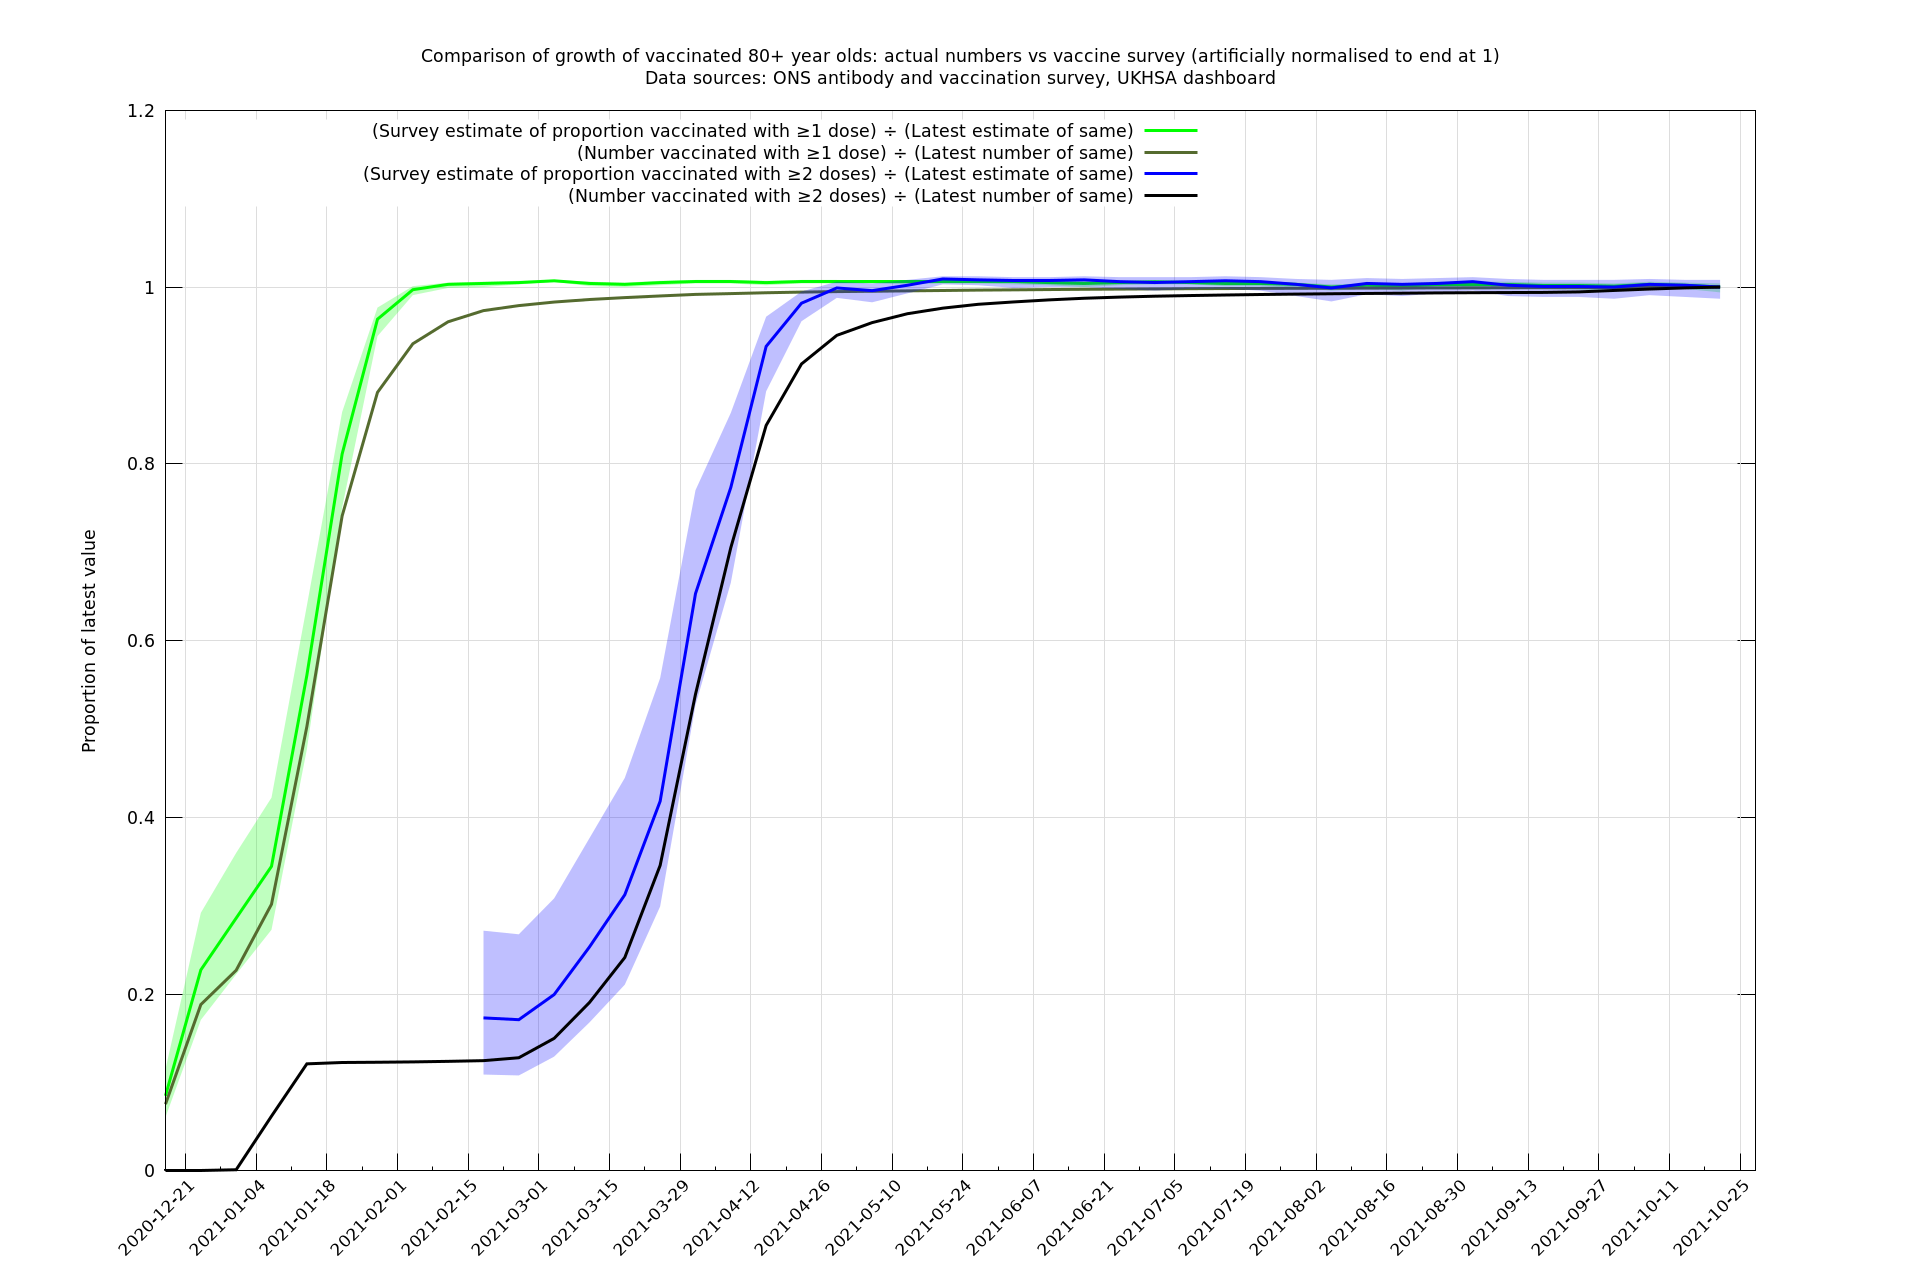
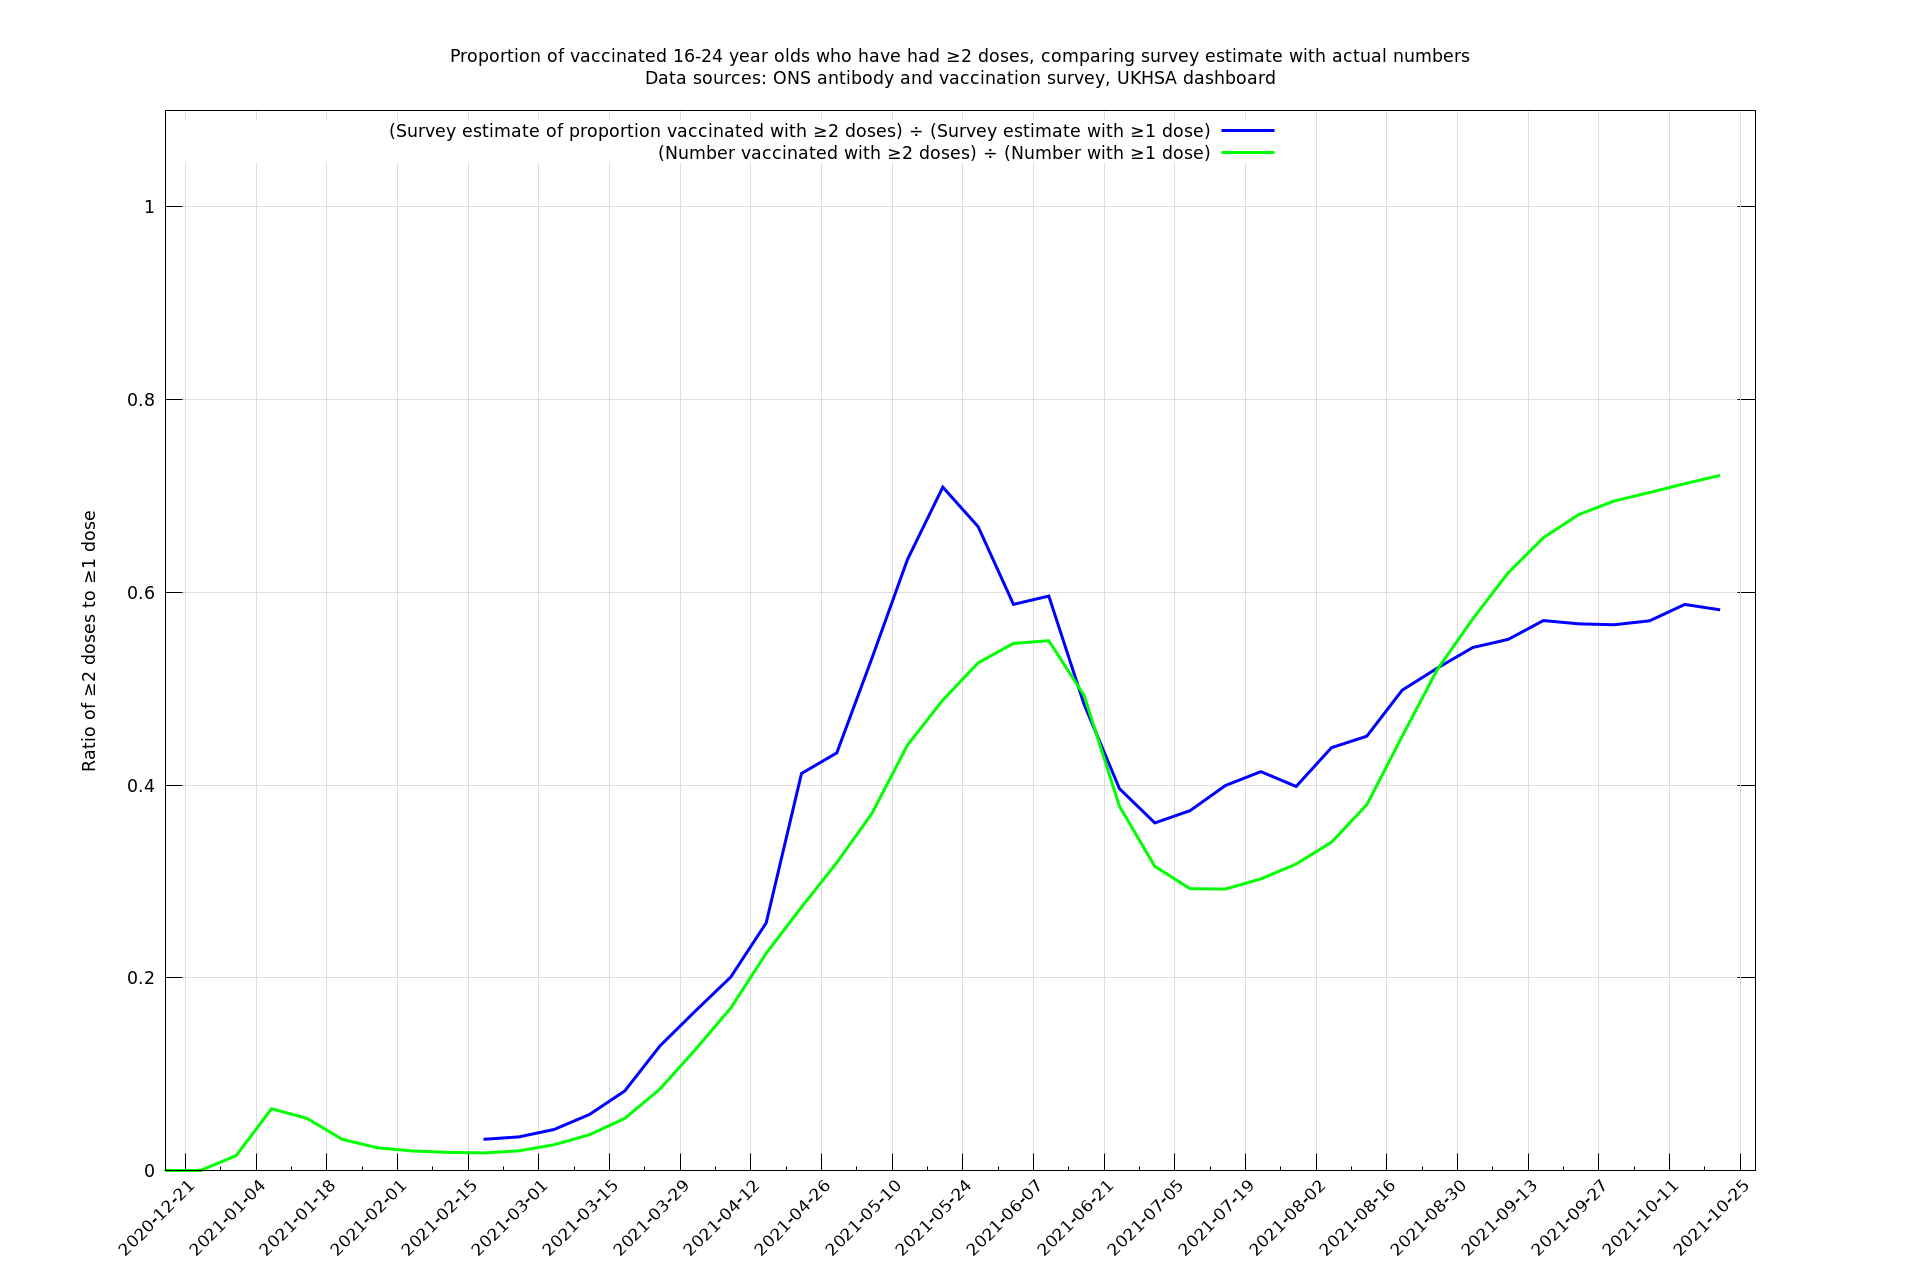
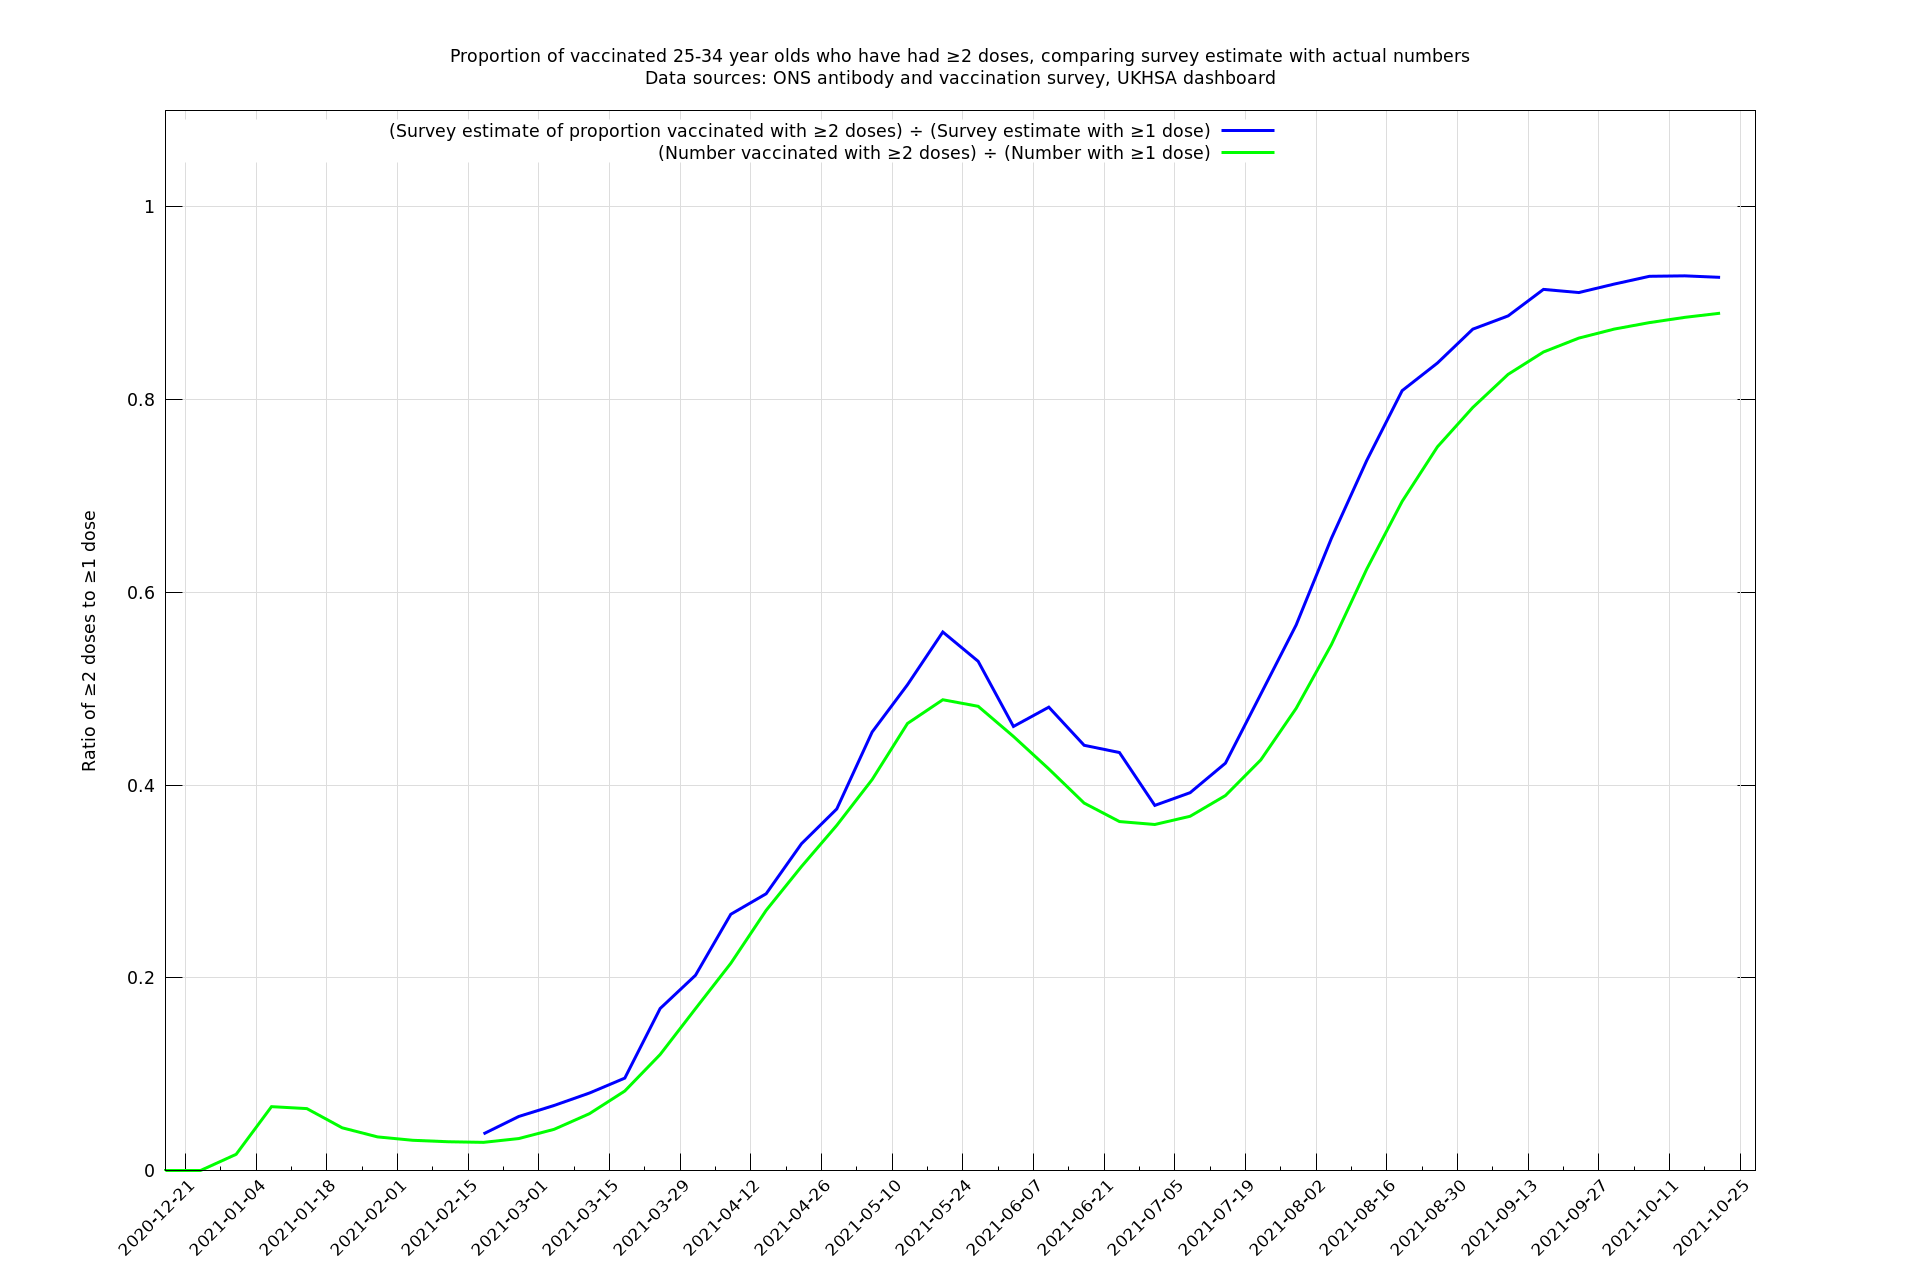
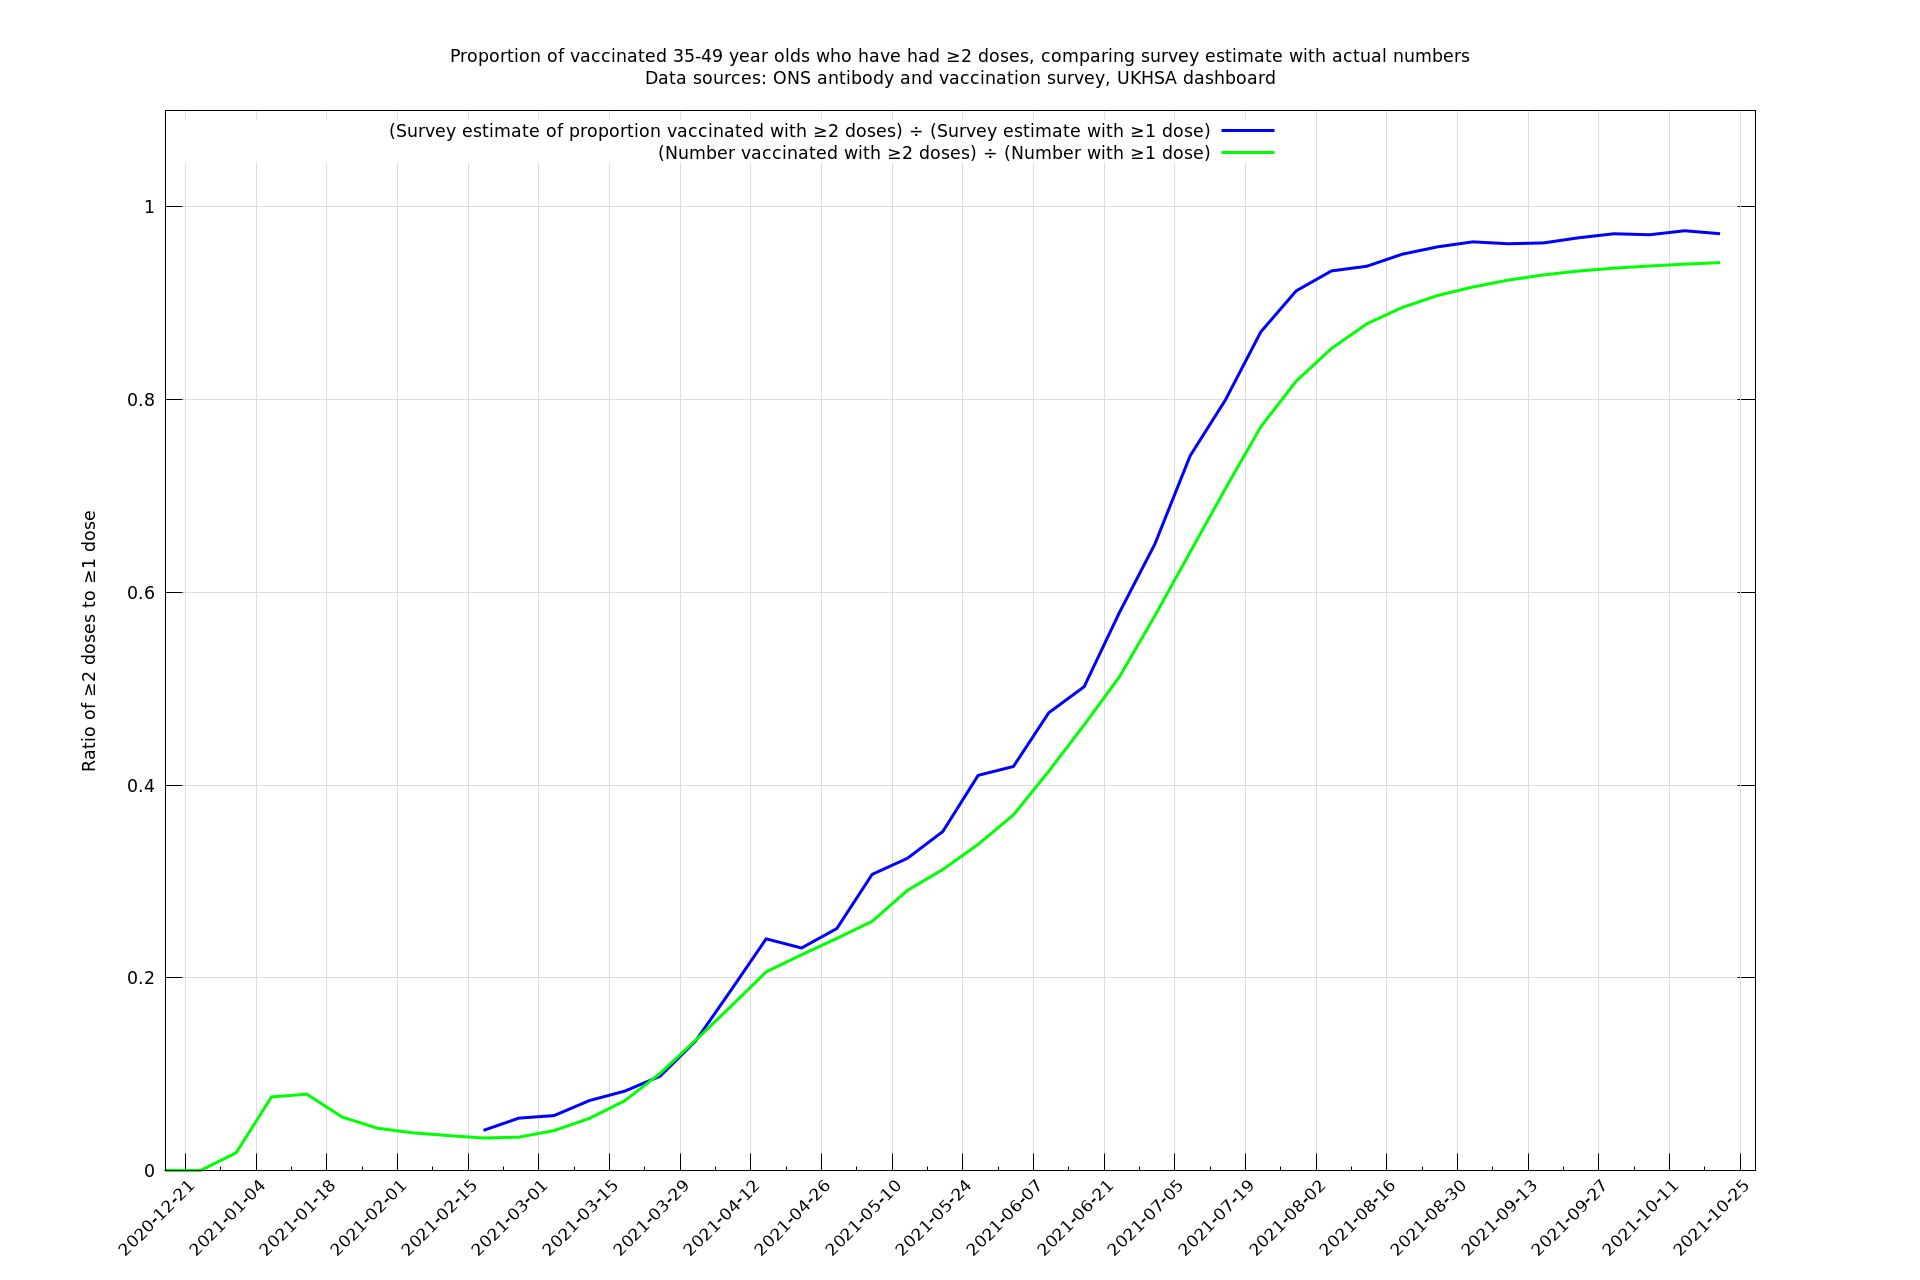
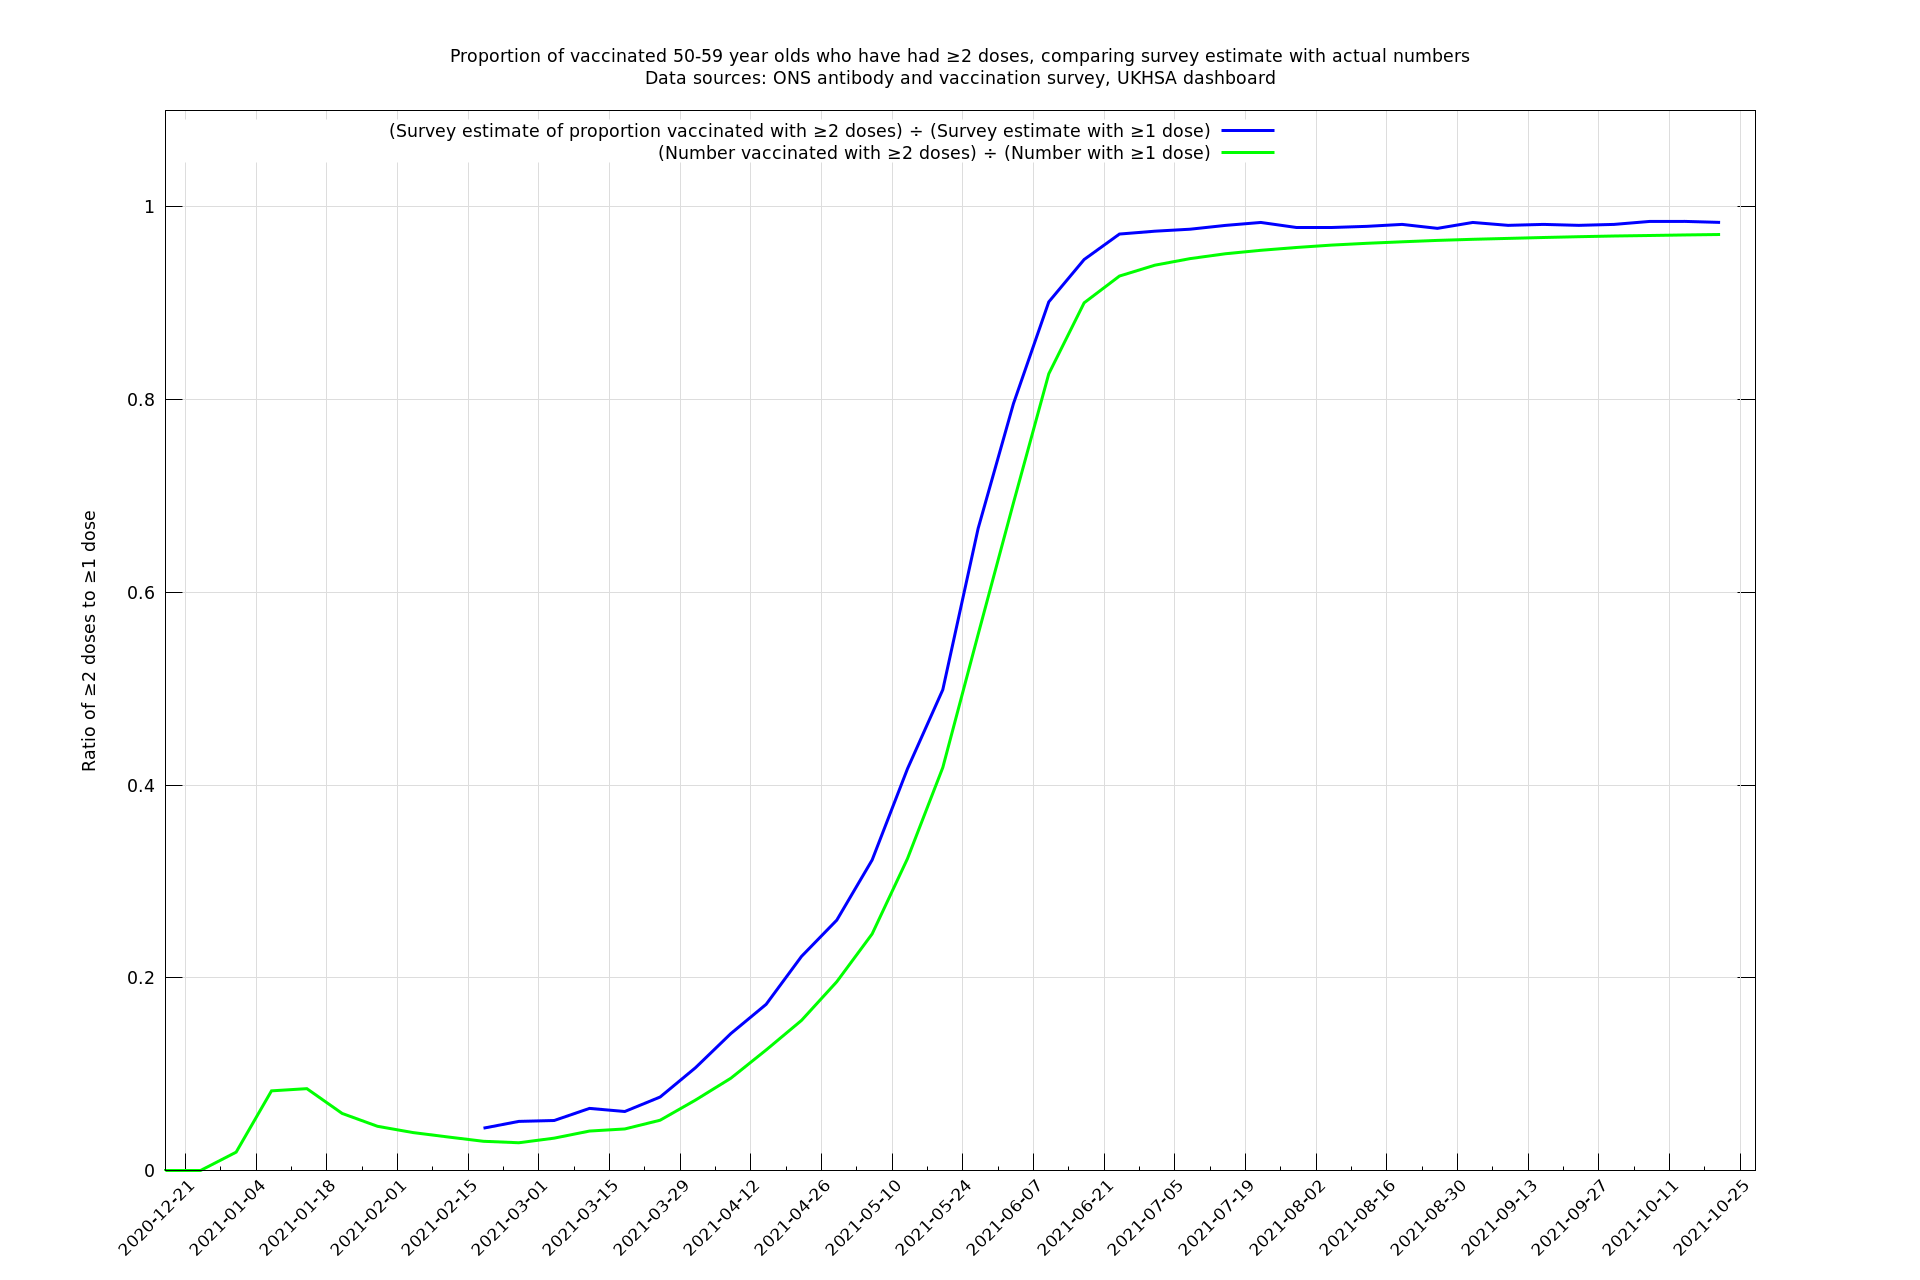
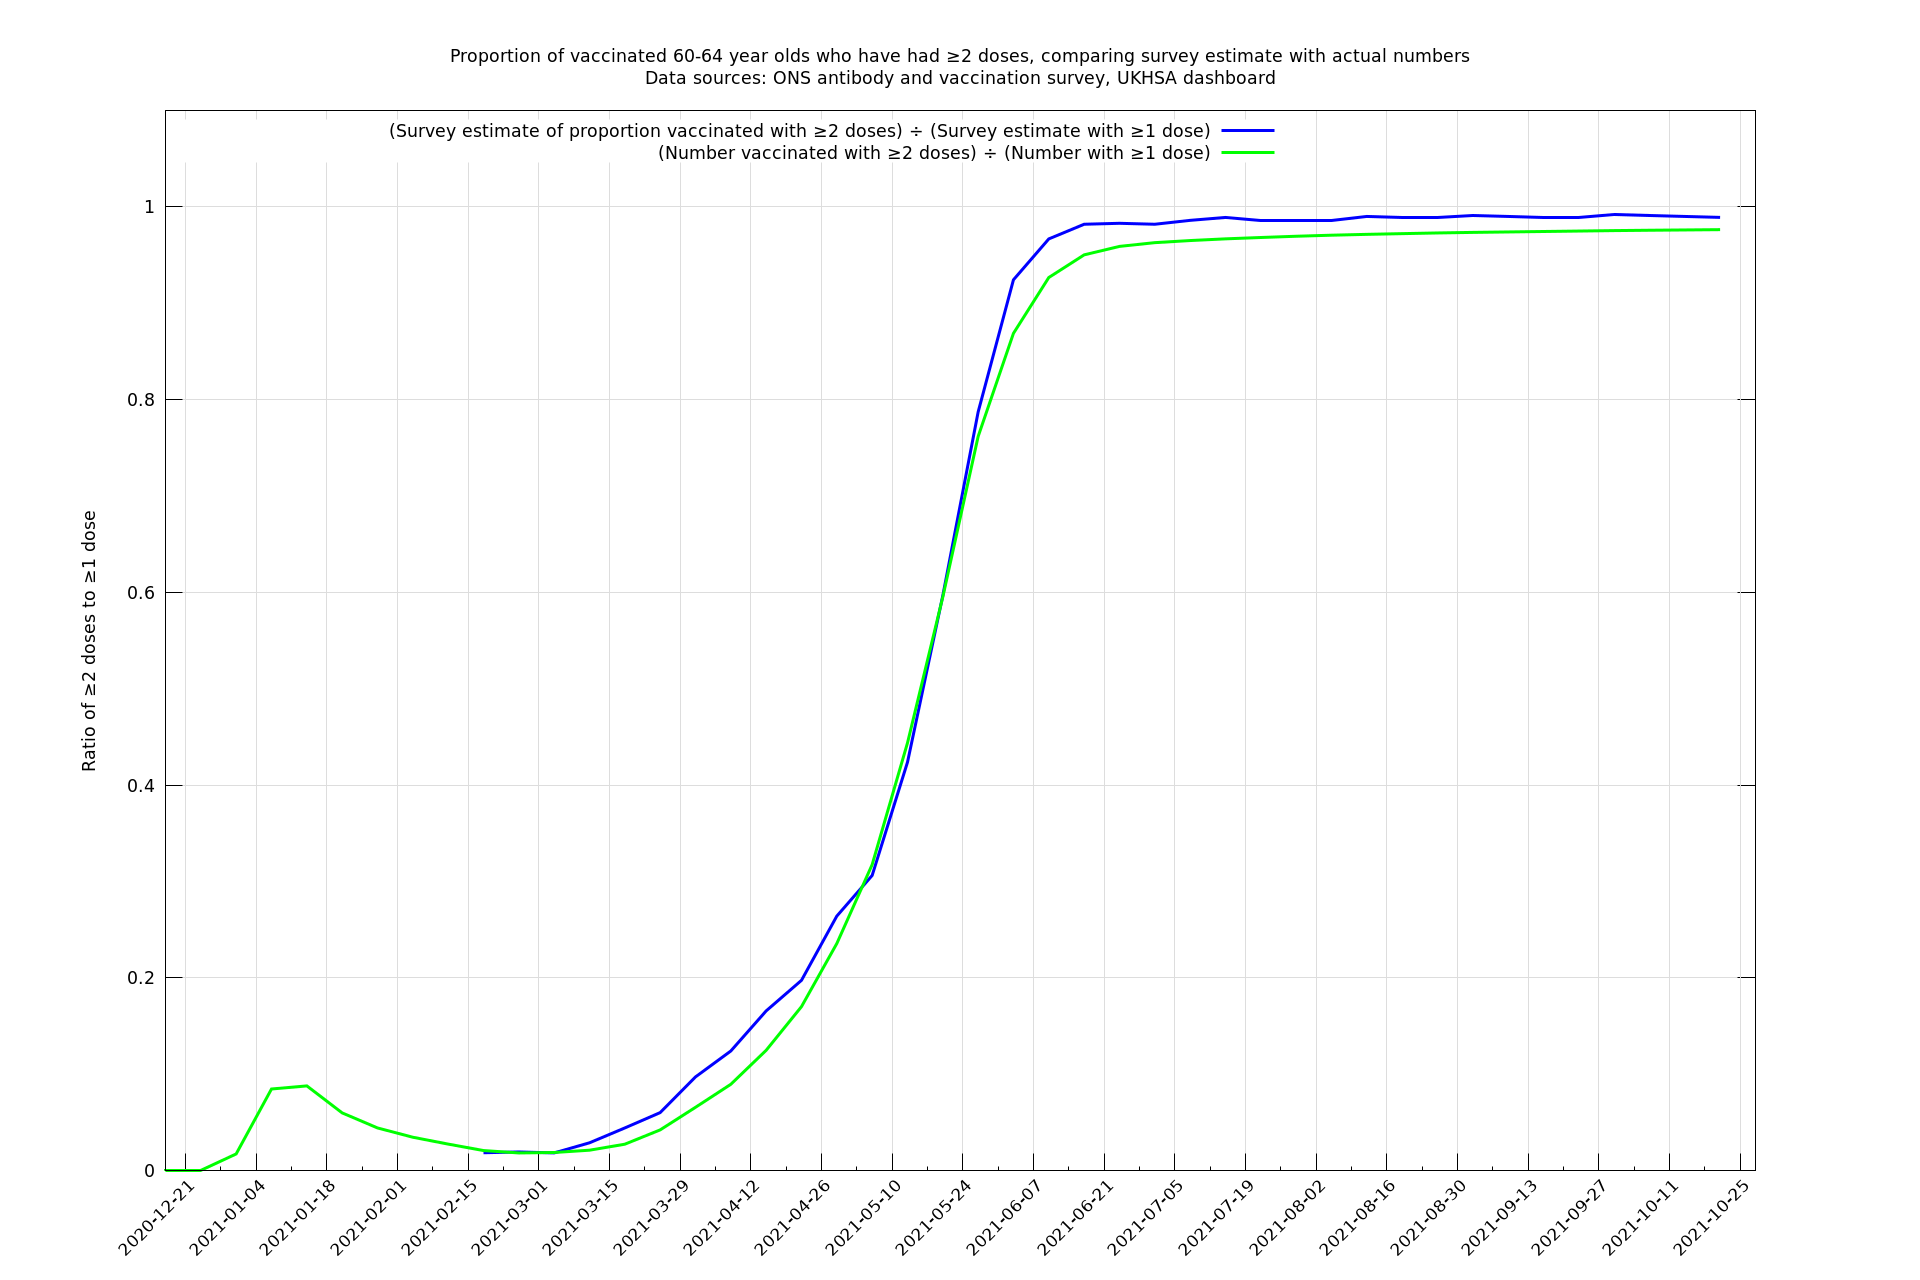
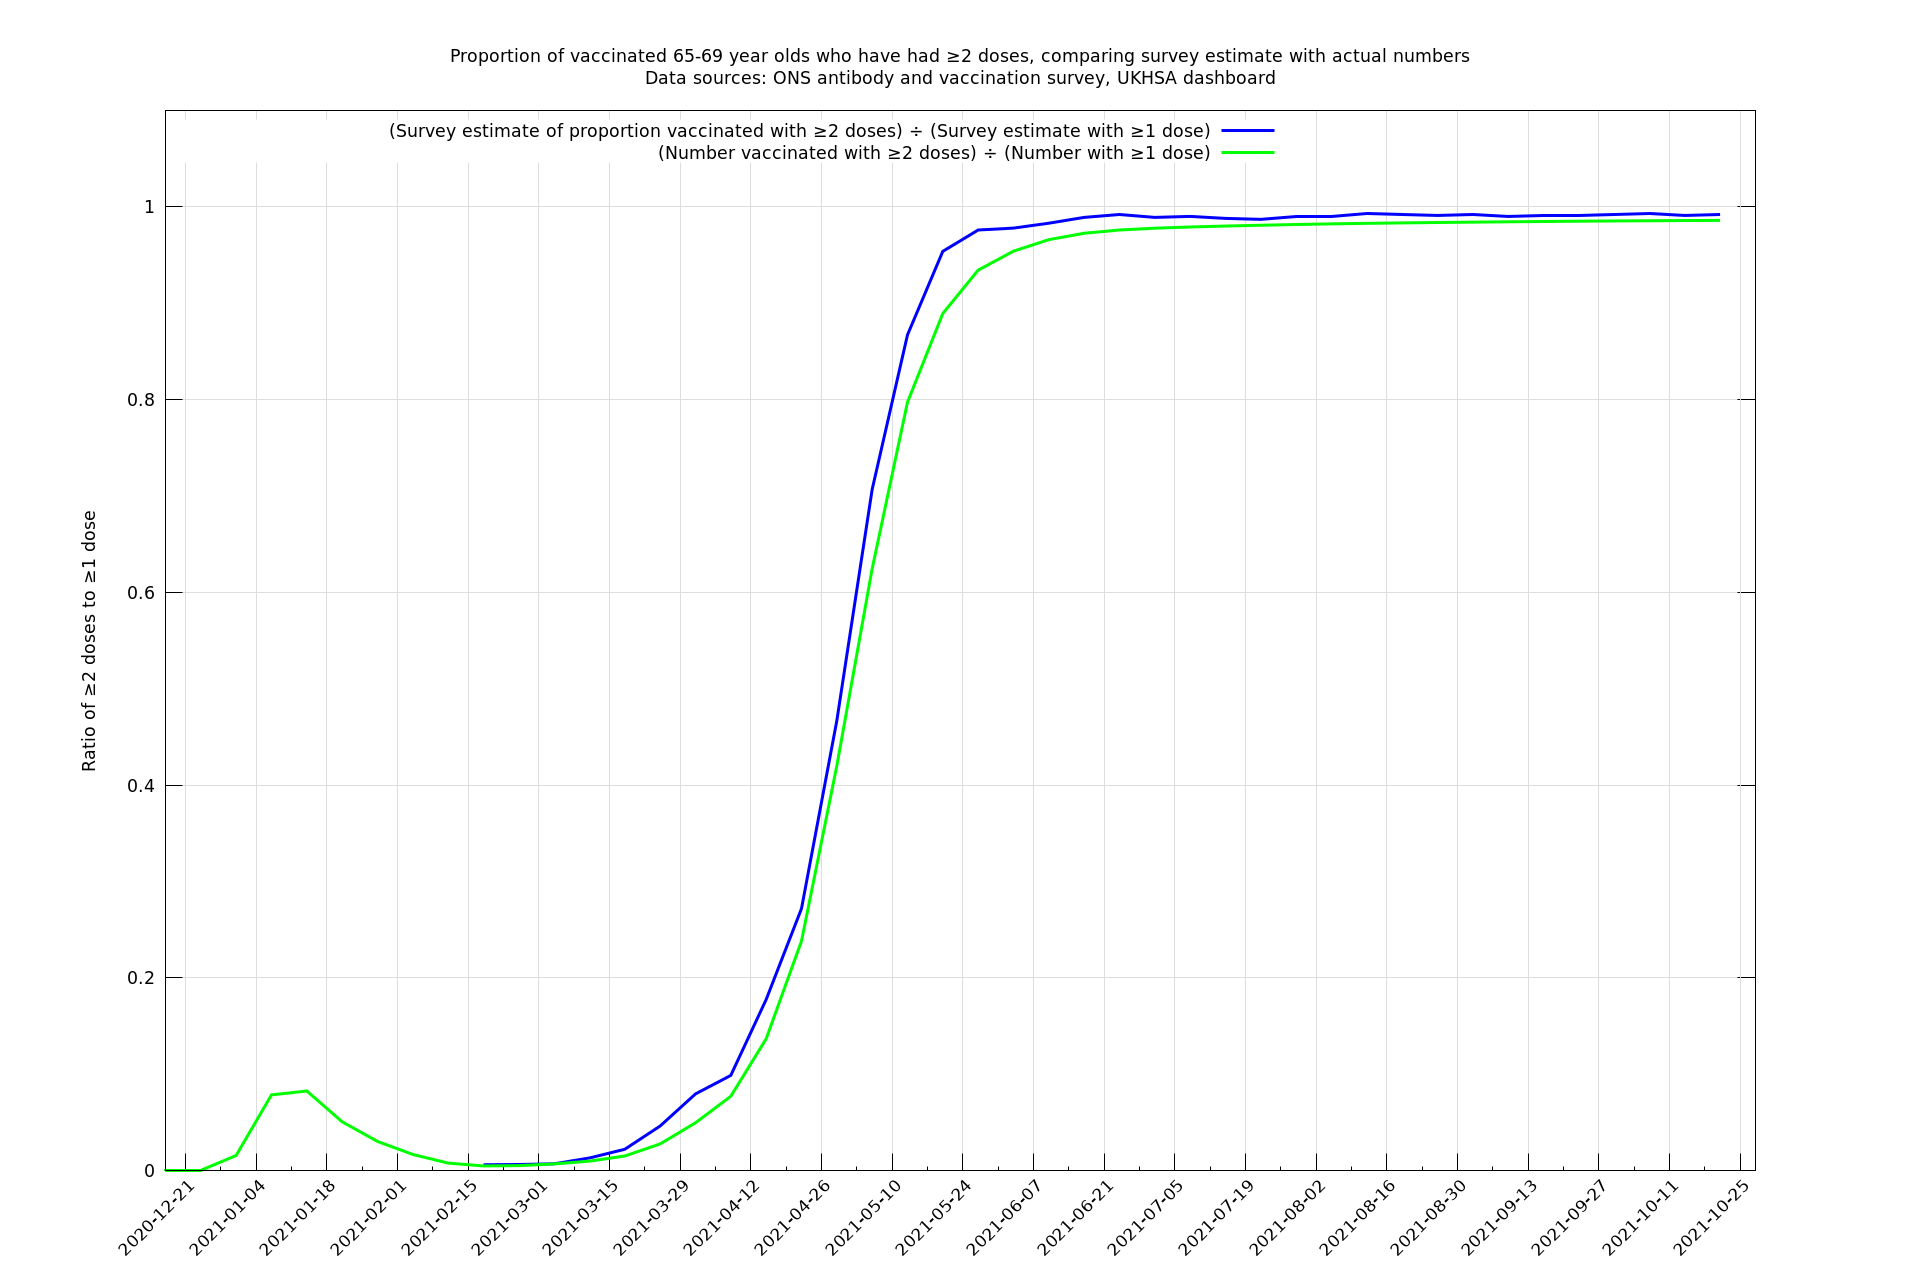
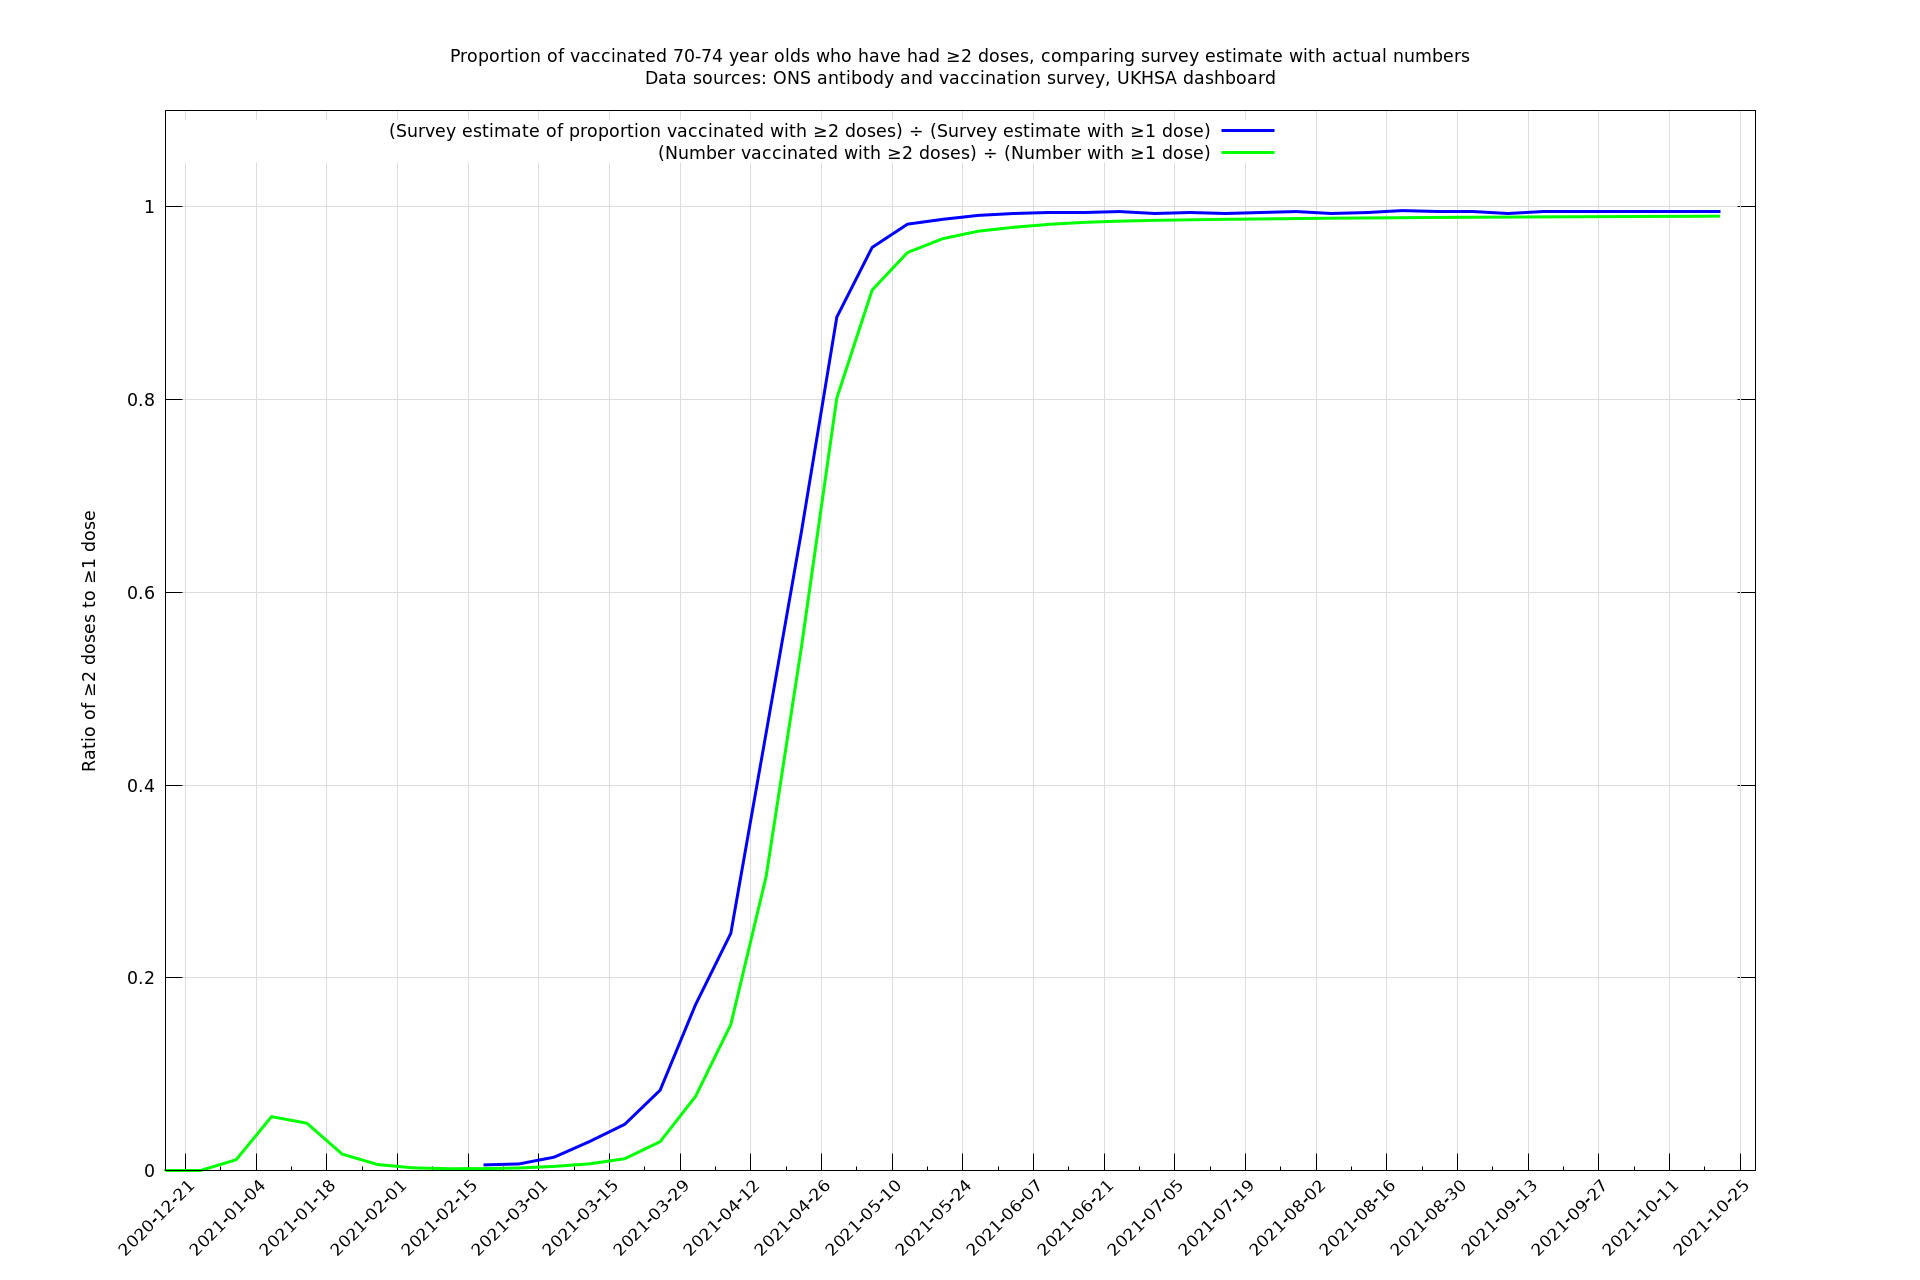
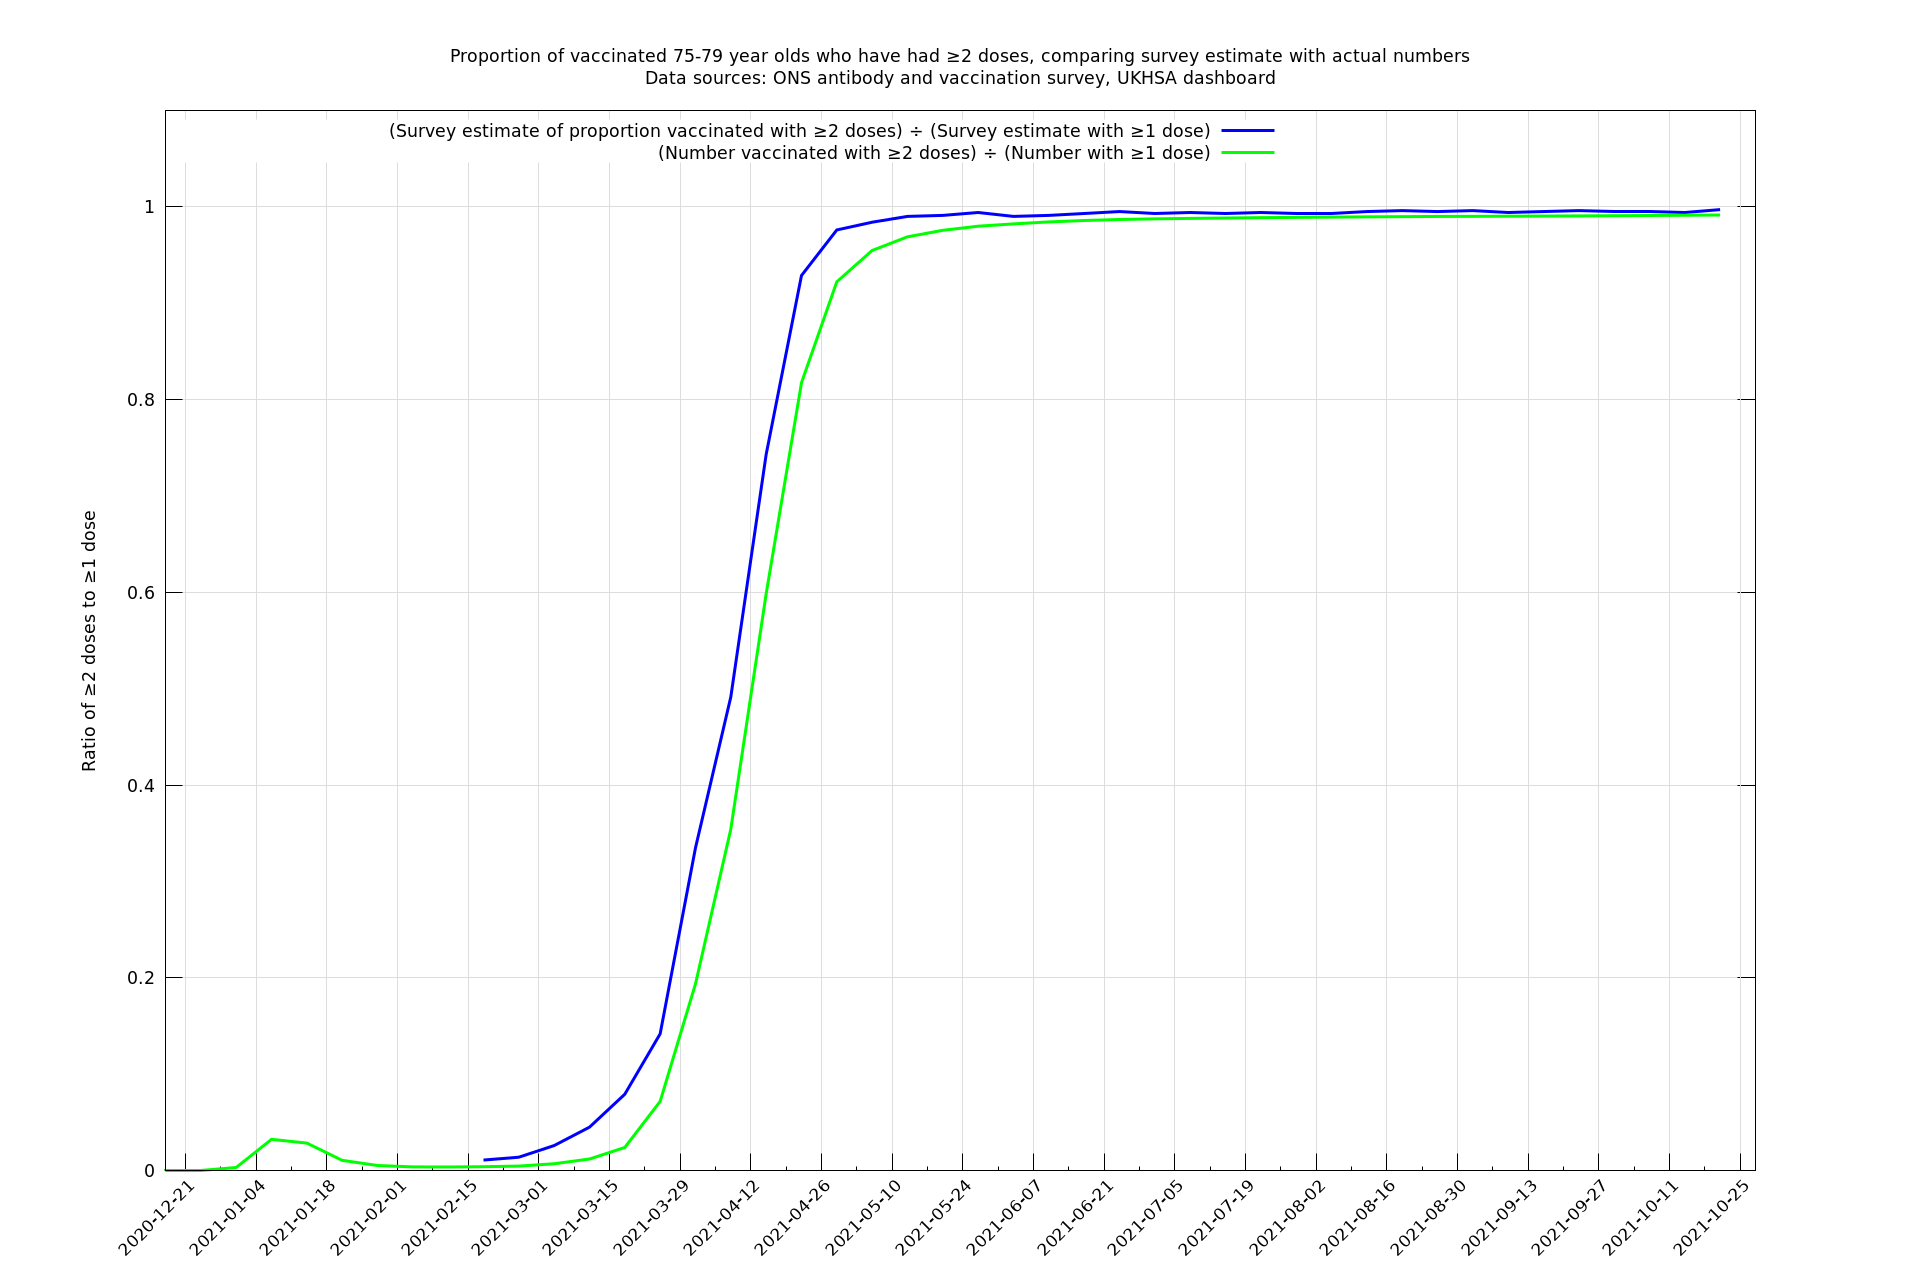
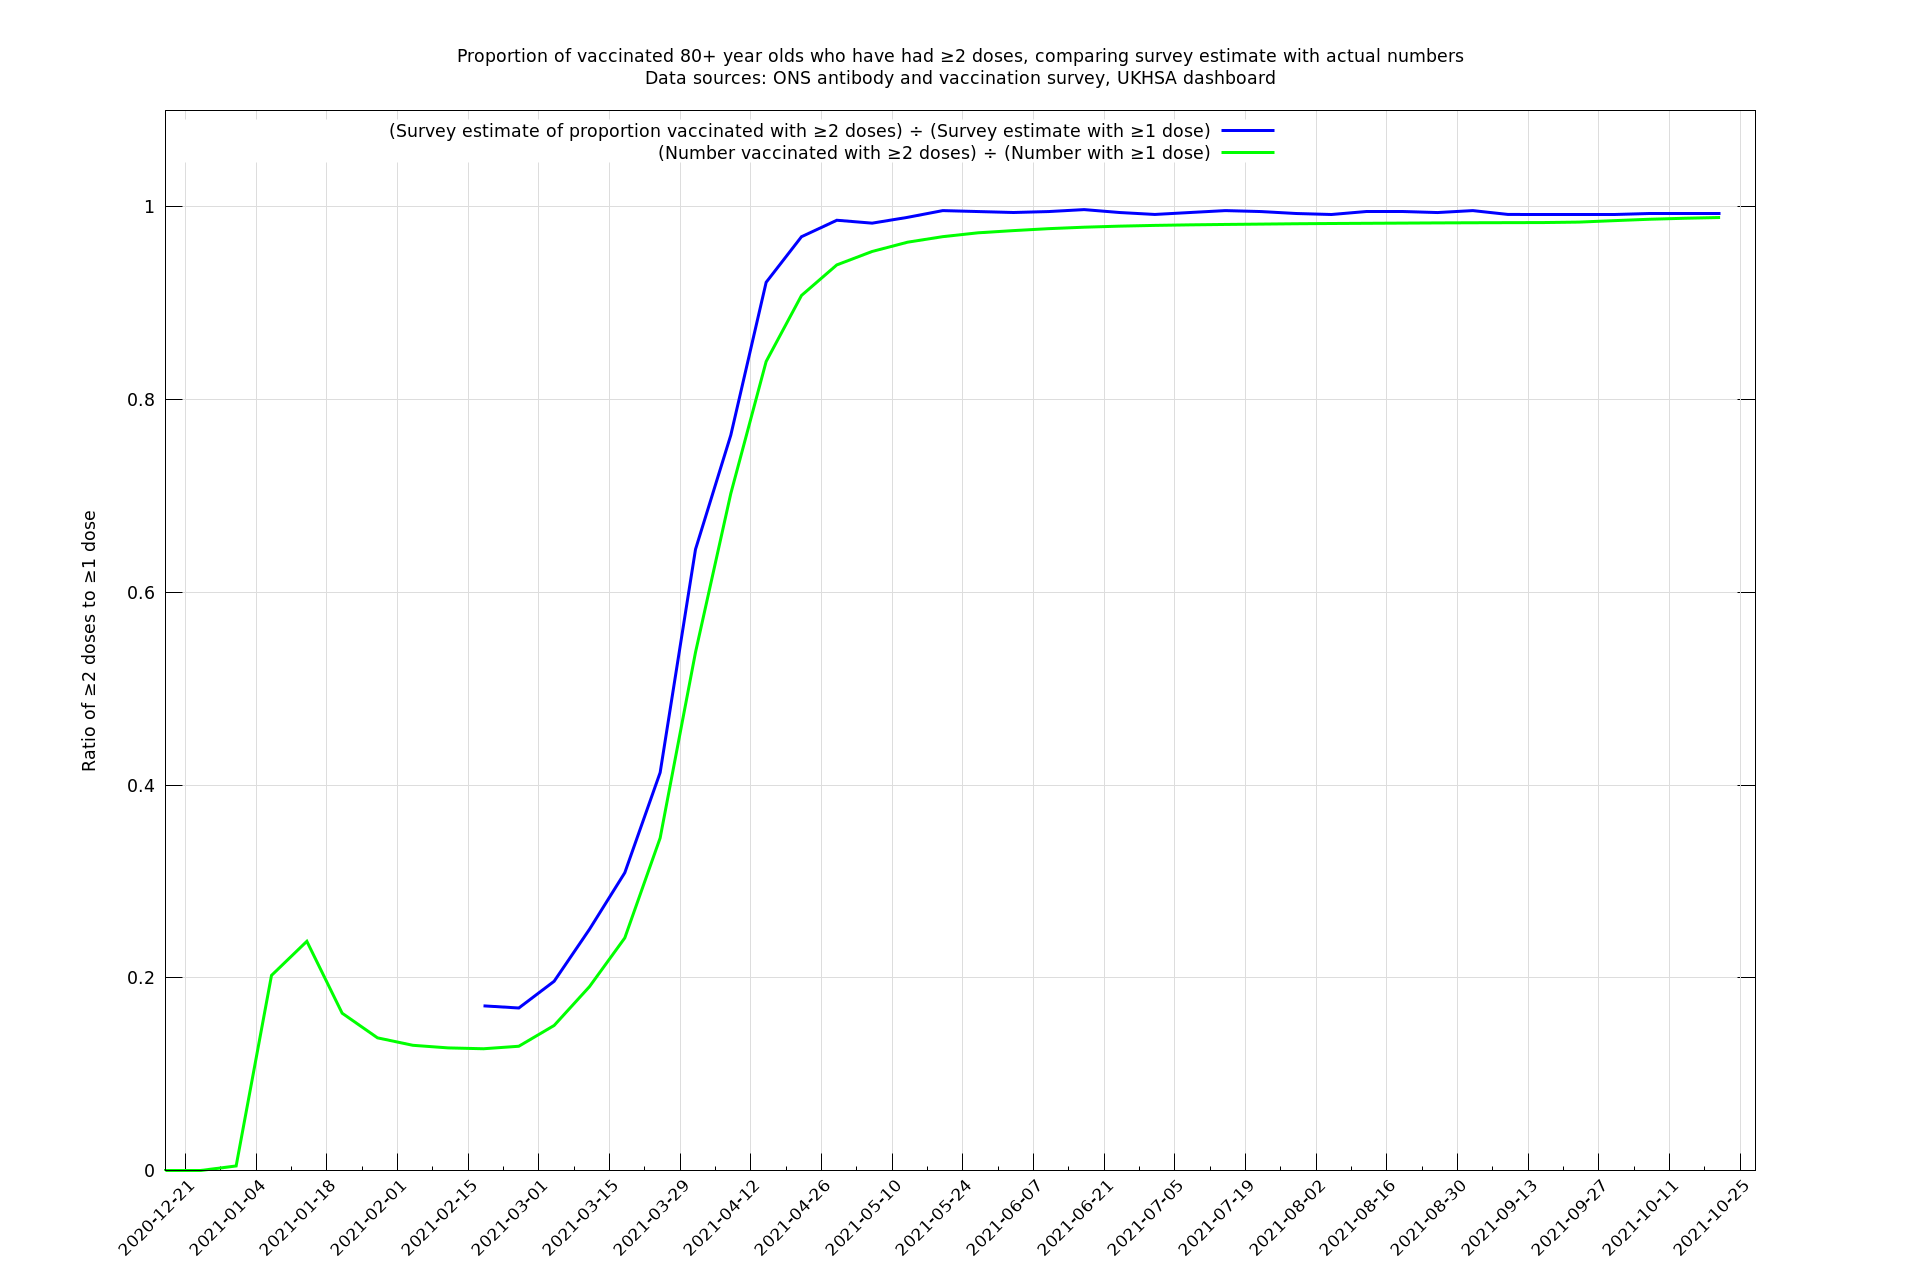
There's something slightly odd about these graphs below, because you would have thought the blue and green lines should match exactly if the vaccination survey is using as much information as it could be to make its estimates.
Discussion of accuracy of vaccination survey-based population estimates
- Survey not finding people; willingness to take part in survey may be correlated with willingness to have vaccine. Partly this is accounted for on post-stratification, but potential dark matter. Tendency from this mechanism would be to underestimate population.
- People dying between being vaccinated and today
- Possibility (h/t @PaulMainwood for alerting the possibility) that the ONS adjust their vaccine survey estimates using some knowledge of their ONS 2020 population estimate, which would make the process of estimating population to some extent circular. (It can't be completely circular because the vaccination-based population estimates are different from the ONS 2020 population estimates.)