Vaccine effect
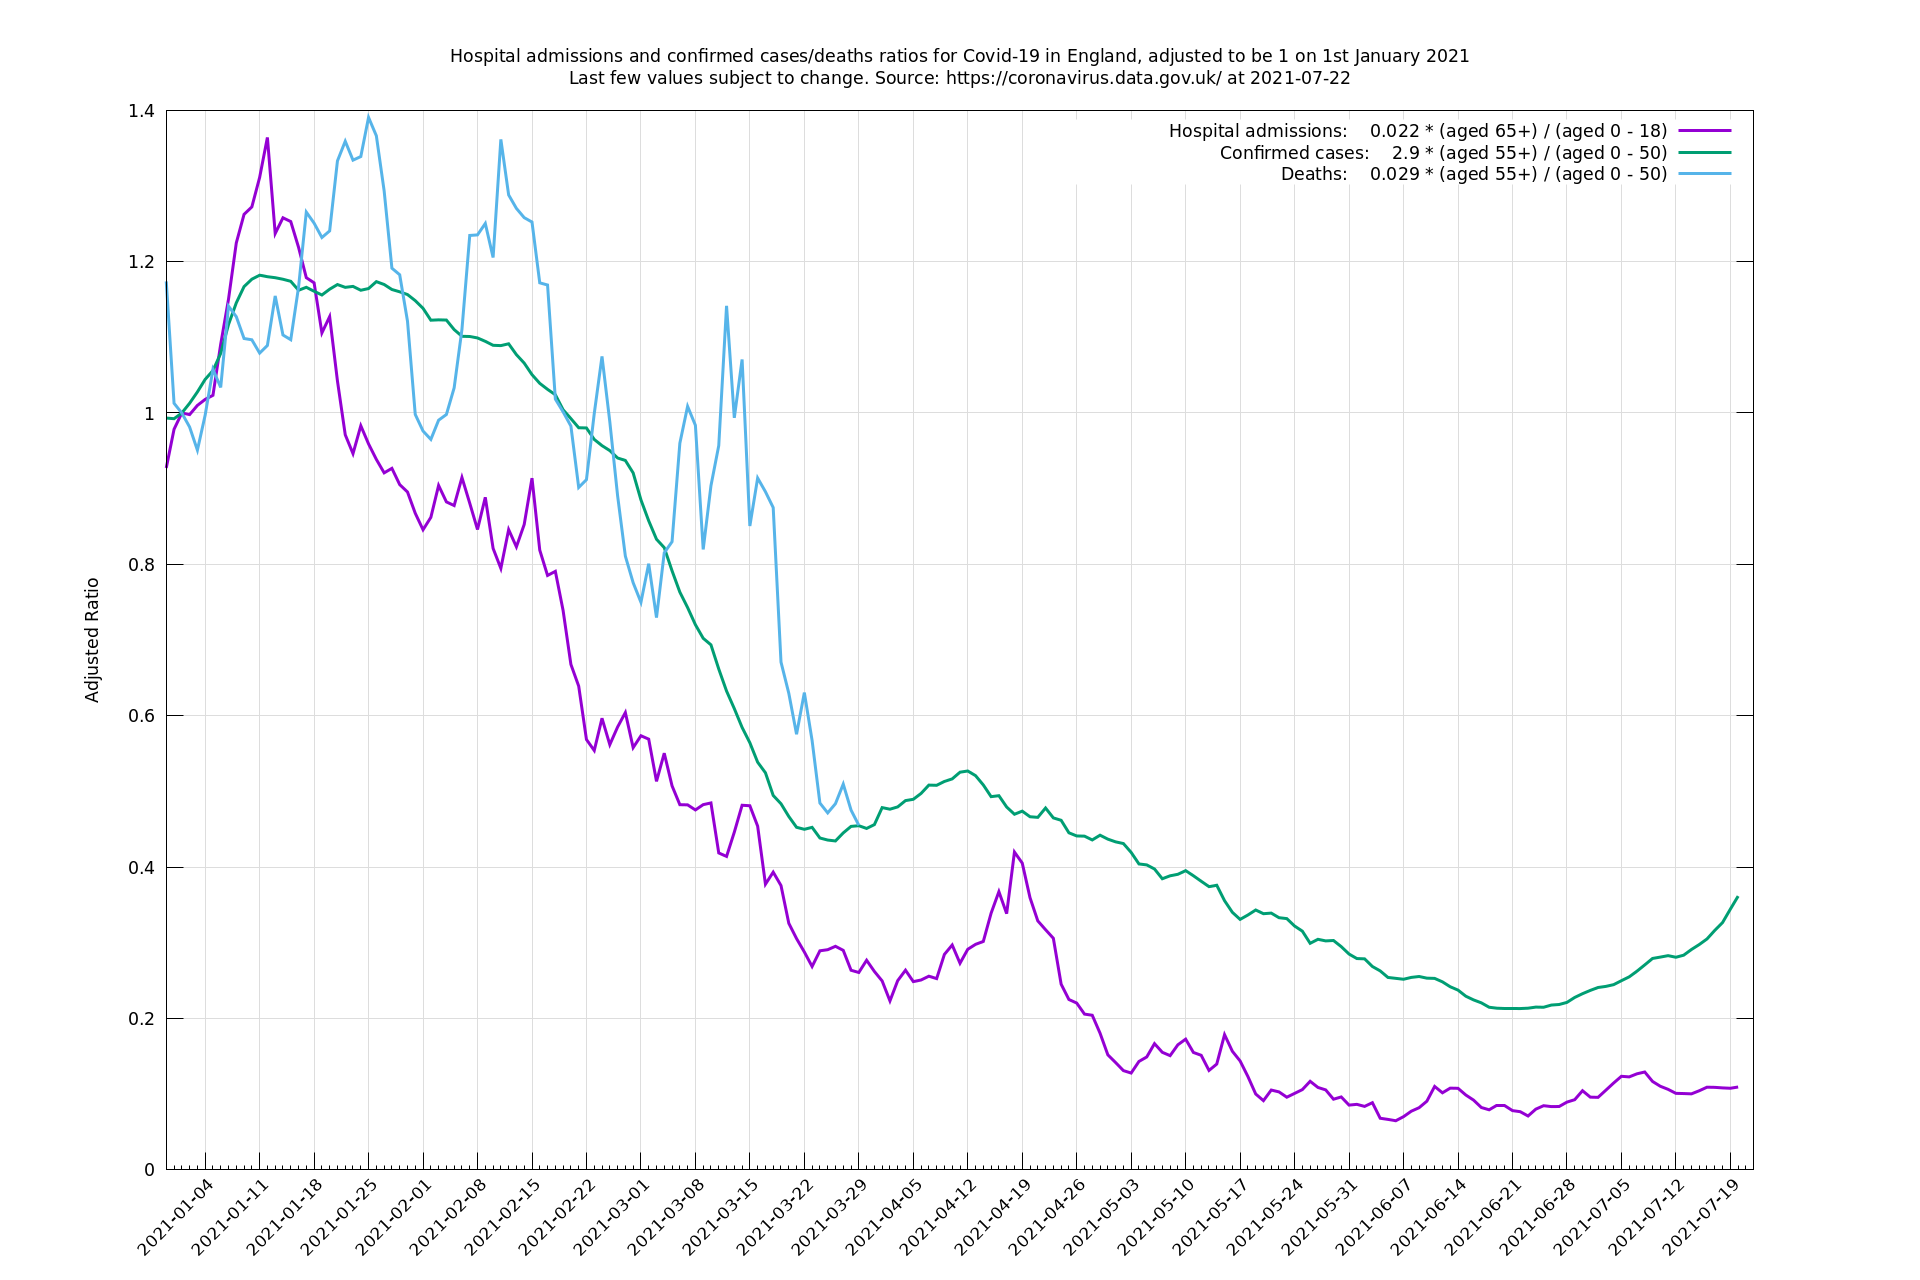
(Falling graphs are suggestive of a vaccine effect. This graph should usually update itself every day, though occasionally there is a delay in values coming through. The last three values may be subject to some retrospective change as a consequence of smoothing that uses future values.)
Note (written 22 July 2021)
I'm retiring (no longer updating) this page now. It was interesting early this year to try to spot a vaccine effect by comparing different age groups, and nice that this could be seen as early as February, before official efficacy studies were released. But now the vaccine has become widespread across all adult ages which makes such an age comparison harder, and there have been many controlled studies since then, such as Lopez Bernal et al, that give better, less confounded estimates.
Note (written 7 May 2021)
Vaccinations have now covered most of the over 50s for at least a month, so the age groups that define the graph have been shifted down once again. The 18-65 band for hospitalisations can't be subdivided, so we're cutting it out of the calculation and going with the ratio of 65+ to 0-18. Deaths have been very rare recently, happily enough, which has made the blue line somewhat random (near 0 divided by near 0) from April, and also possibly made it unduly affected by a few deaths from natural causes creeping in. Accordingly, the blue line now stops at the end of March.
Note (written 6 March 2021)
Since the vaccination programme has progressed down through the age groups and now includes a lot of the 65+, it is making less sense to assume that it's mostly the 80+ who are vaccinated and the 65+ are unvaccinated. Accordingly, the above graph's age bands have been adjusted downwards. The previous version of the graph can be found below.
Note (written 31 Jan 2021)
At the time of writing, both green and purple lines are roughly stable, which is obviously not as good as falling from the point of view of demonstrating a vaccine effect now. Speculation, but a possible mechanism is this: the recent lockdown has had a much stronger effect on the 18-64 age group than the 80+ age group, because the 80+ group was mostly following lockdown-like rules anyway, whereas the 18-64 group would have had their activities curtailed considerably more. (Thanks to Stephen Streater for pointing out this possibility.)
There is arguably some evidence for this pattern in the earlier portions of the above graphs which rise during the November lockdown period, fall with the December opening up, and rise again in the January lockdown period up to around 11 Jan when, maybe, the effect of vaccinations cancelled out this rise and turned it into a roughly flat line.
Whatever you think about that idea, a better answer is likely to be had soon from the publication of a more detailed breakdown of vaccinations and confirmed cases using information that is not currently publicly available. Ideally we'd like to be able to compare things like cases amongst 80+ year-olds who did get the vaccine with those who didn't, and this is something Public Health England is in a position to do.
Description (written 14 Jan 2021)
The purpose of this page is to try to see an early sign that vaccines in the UK are working. Just looking at the number of daily cases or hospital admissions wouldn't tell you very much because these numbers are also driven by distancing/lockdown restrictions, so it is better to try to compare the relative number of cases (or hospital admissions) between the vaccinated and unvaccinated, and currently age is a good proxy for vaccination status. The UK Coronavirus data api provides a breakdown of hospital admissions for Covid-19 in England by age groups: 0-5, 6-17, 18-64, 65-84, 85+, and also a breakdown of confirmed cases by a finer range of age groups. (I had originally meant to look at UK-wide numbers, but admission figures from hospitals in Scotland appear to be delayed by a few days, and figures from Wales are calculated on a different basis, so I ended up just using English figures.)
At the moment in the UK most vaccinations are in the 80+ age group. Ideally the hospital admission statistics would be broken down more finely by age, or would include vaccination status, so we wouldn't have to lump (mostly vaccinated) 80-84 year olds in with (mostly unvaccinated) 65-80 year olds, but if we exclude this middle group (65-84 year olds), we might expect the proportion: number(85+)/(number(18-64)+number(85+)) - the purple line in the first graph - to be a decent proxy for how well vaccinations are working.
Another measure of interest is to look how many confirmed cases there are amongst the vaccinated group. In this case the api provides a finer age breakdown so we can look at the number of 80+ year old confirmed cases. We choose to normalise by the number of 65+ year old confirmed cases, as opposed to all confirmed cases, on the grounds that many 65-79 year olds are retired and they will tend to have more similar behaviour to the 80+ year old group than would a randomly-aged person.
There are possible confounding effects, for example if young people got infected over Christmas and are in the process of passing it on to older people, or if older people having received the vaccine engage in more virus-risky activity, or whatever, but hopefully the vaccine will be sufficiently effective that regardless of these and these indictaors will start to decrease over the next week or two.
Graphs made using this code.
Thanks to James Ward for helpful suggestions.
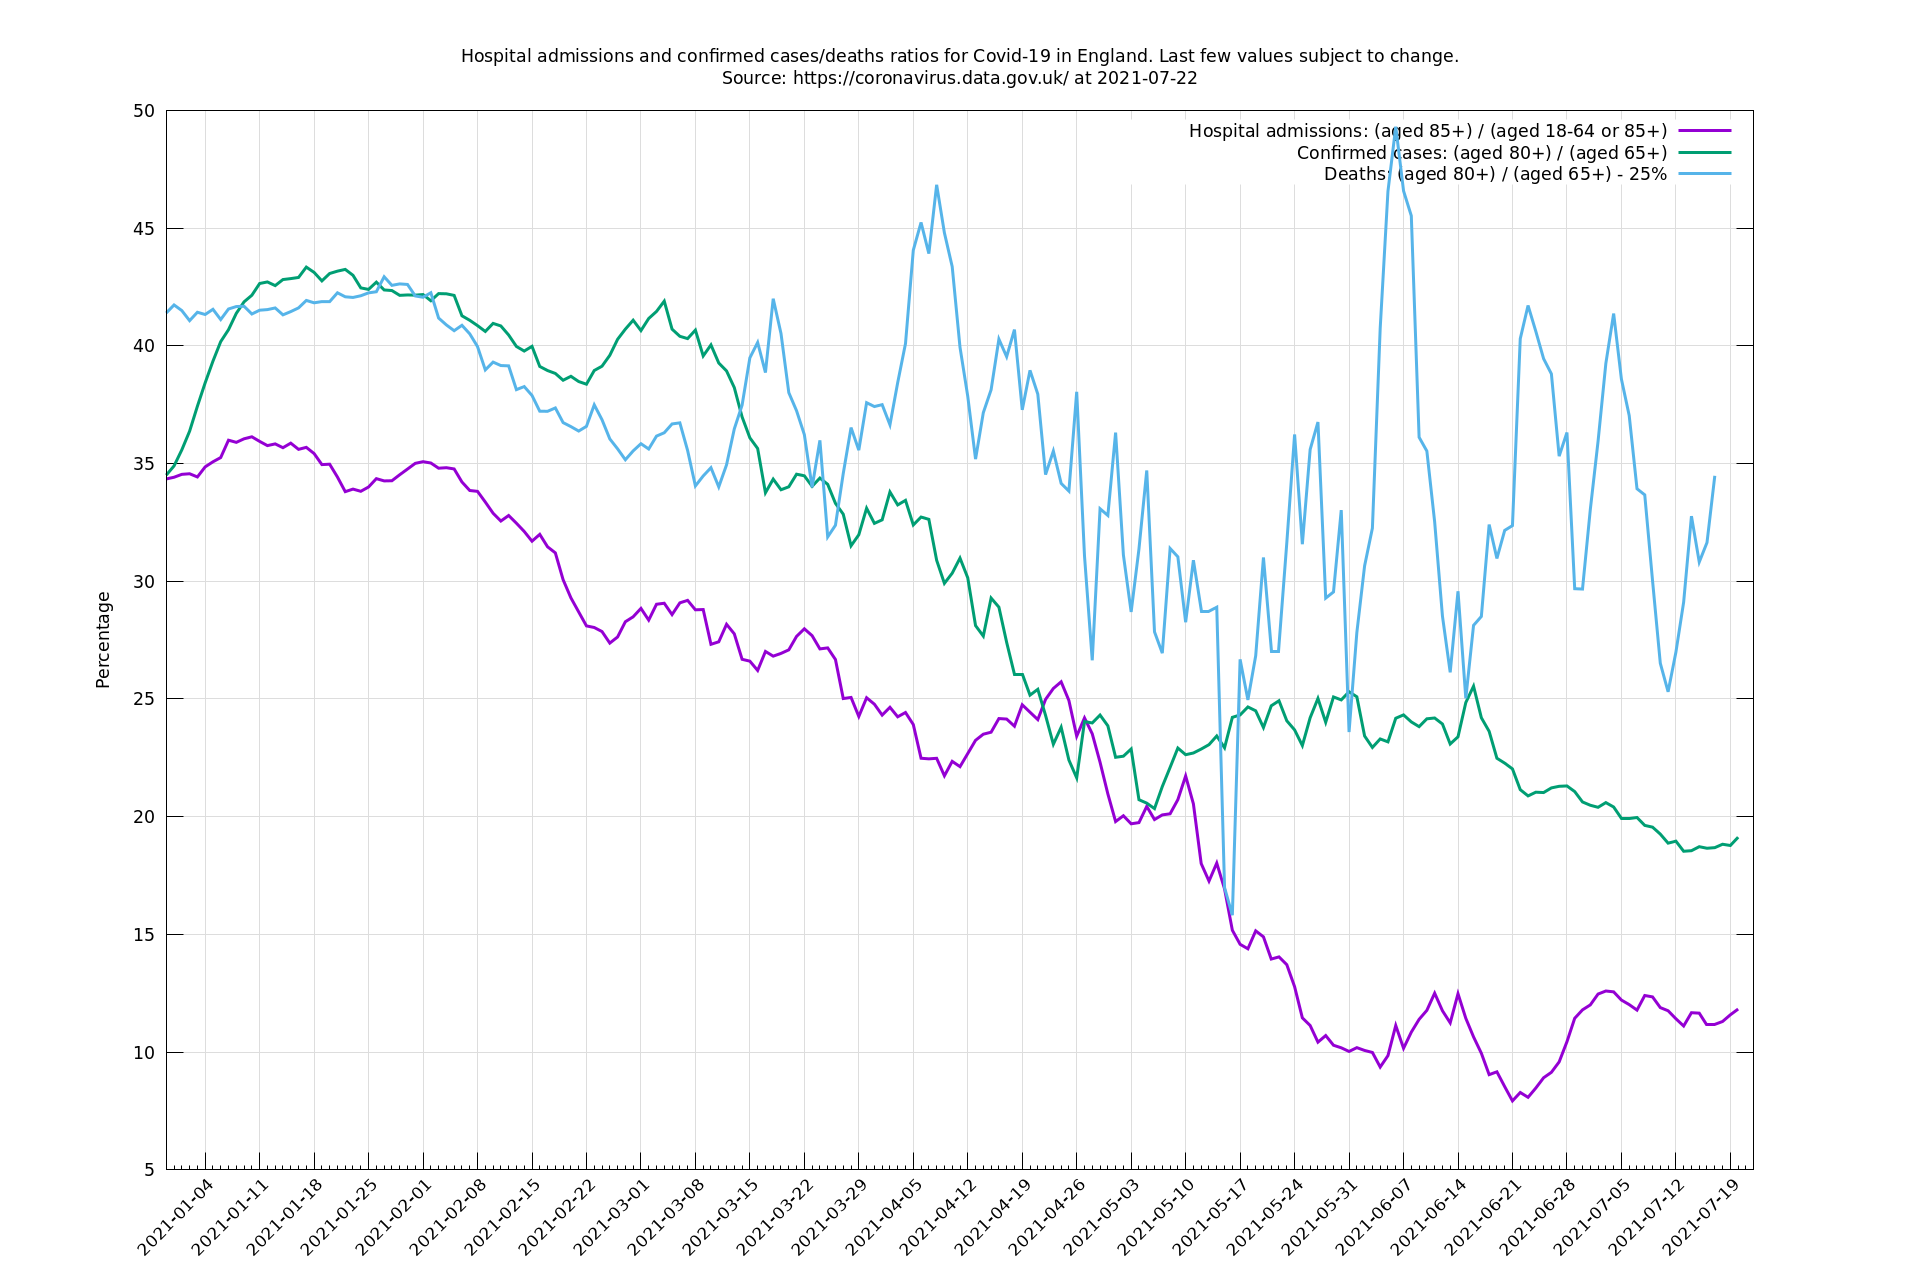
(This graph should usually update itself every day, though occasionally there is a delay in values coming through. The last three values may be subject to some retrospective change as a consequence of smoothing that uses future values. Note that the blue curve showing the ratio of deaths has been lowered by 25% to make it easier to compare with the other curves and to allow the y-axis range to stay narrow, which means the variations show up more clearly.)
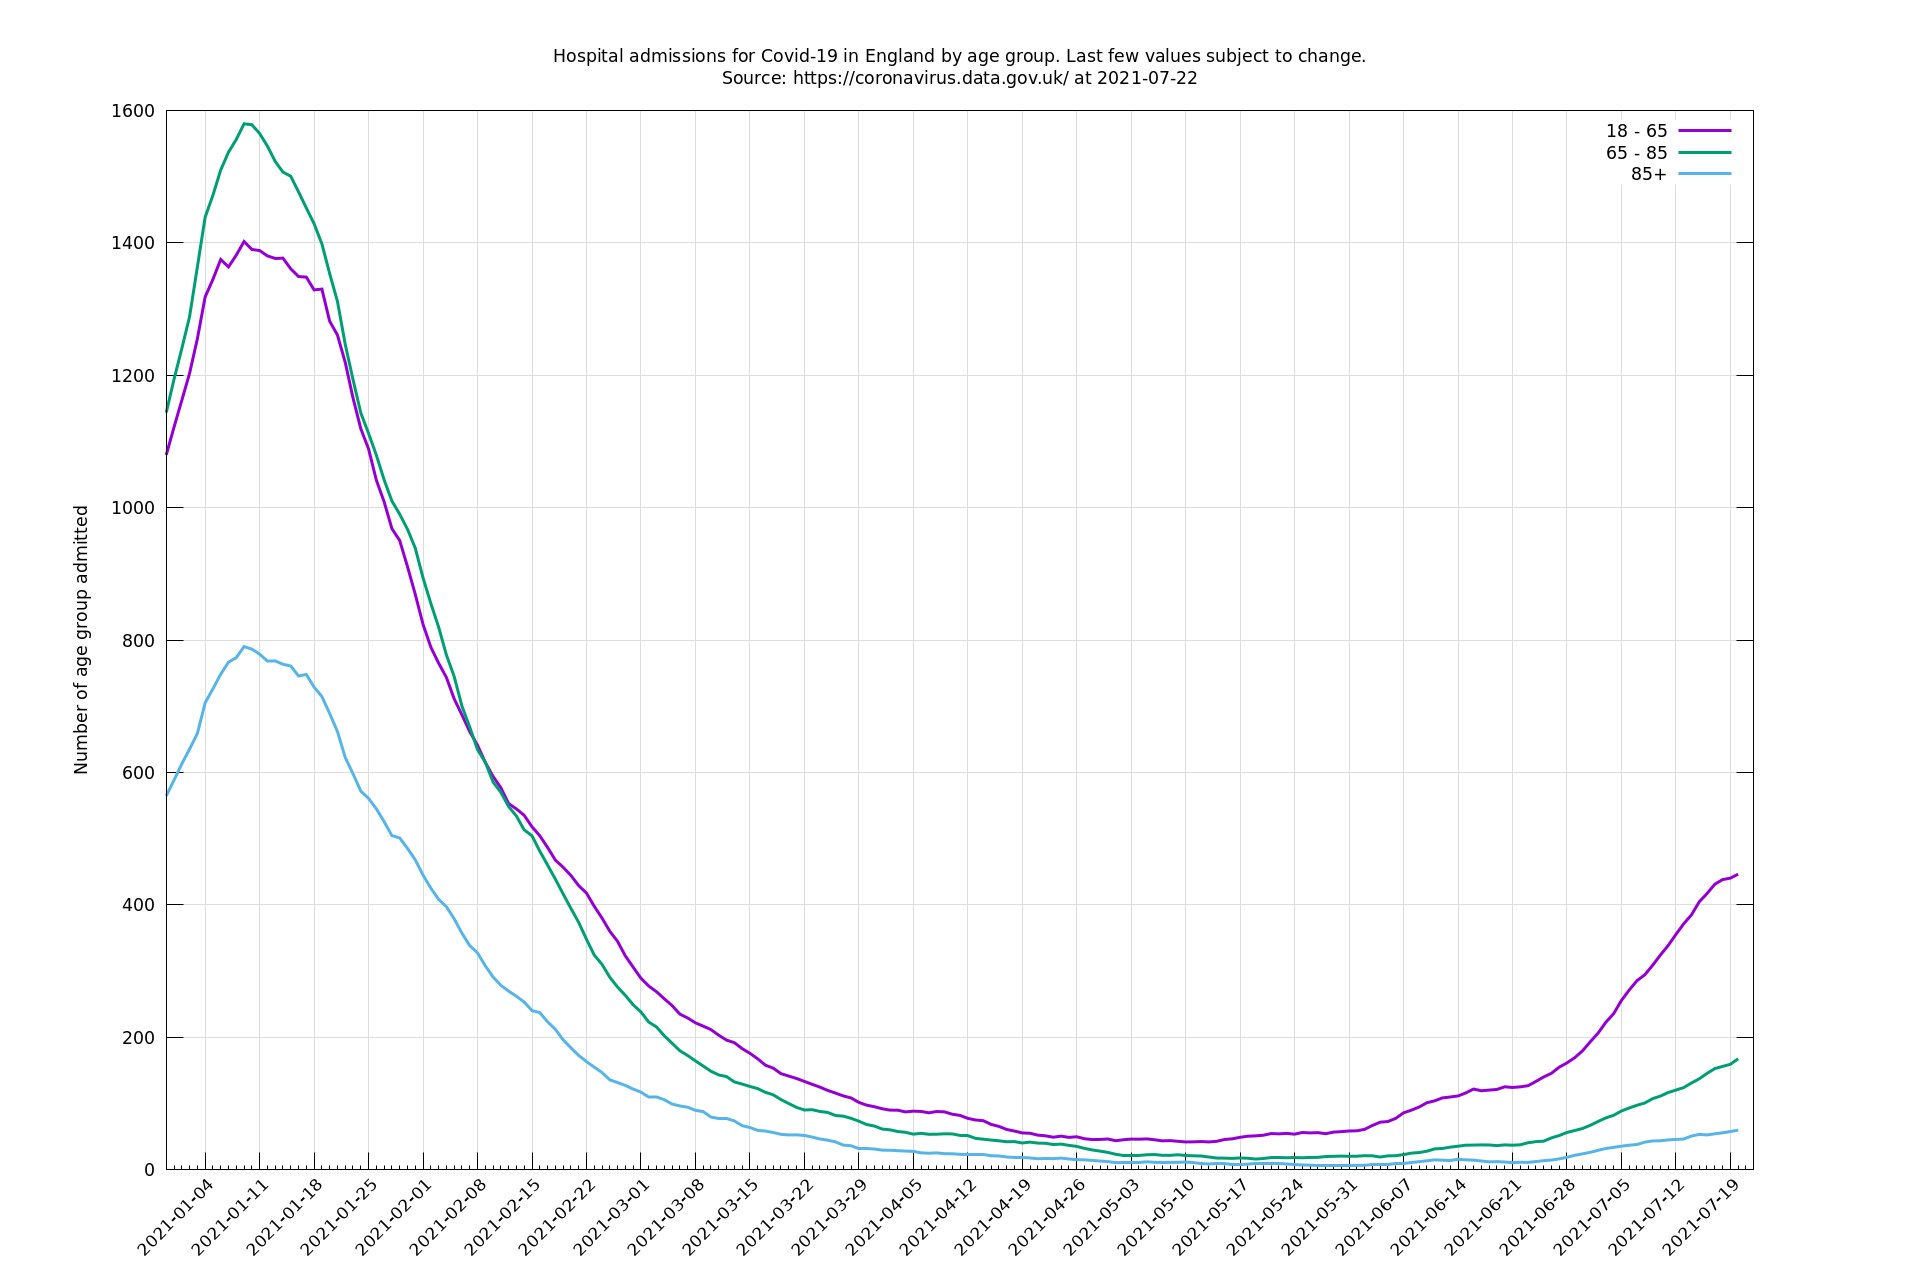
(This graph should update hospital admissions about once a week. The last three values may be subject to some retrospective change as a consequence of smoothing that uses future values.)