Difference between revisions of "UK variant comparison"
| Line 1: | Line 1: | ||
= Self-updating graphs showing current situation = | = Self-updating graphs showing current situation = | ||
| − | These graphs should auto-update every day or two, according to when there is new sequence data from [https://www.cogconsortium.uk/tools-analysis/public-data-analysis-2/ COG-UK]. You may need to hit shift-reload or some such to defeat your browser's cache. | + | These graphs should auto-update every day or two, according to when there is new sequence data from [https://www.cogconsortium.uk/tools-analysis/public-data-analysis-2/ COG-UK]. You may need to hit shift-reload or some such to defeat your browser's cache. More recent updates appear towards the top of this page. |
These graphs compare one or more variants with another "baseline" variant. A y-co-ordinate of 0 corresponds to equal number of new cases per day of a variant compared to the baseline variant. The purpose of presenting it this way, with a particular chosen baseline variant, as opposed to several variants on an equal footing, is that it means we expect to get straight lines to some reasonable approximation. | These graphs compare one or more variants with another "baseline" variant. A y-co-ordinate of 0 corresponds to equal number of new cases per day of a variant compared to the baseline variant. The purpose of presenting it this way, with a particular chosen baseline variant, as opposed to several variants on an equal footing, is that it means we expect to get straight lines to some reasonable approximation. | ||
| − | Note that the growth estimates here rely on sequenced cases, of which there are currently about 1, | + | Note that the growth estimates here rely on sequenced cases, of which there are currently about 1,500 per day, being representative of infections. This assumption may or may not hold, though it appears to work well in many cases. We often see a good linear fit over an extended period (say, several weeks) which arguably constitutes evidence in its favour, because many distortions you may think of, such as preferential sequencing of a particular variant for a limited time period, or different growth rates in different subpopulations, or different sets of susceptible populations, would often have the effect of knocking the relationship off being linear. |
Program used for analysis: [https://github.com/alex1770/Covid-19/blob/master/VOCgrowth/uk_var_comp.py uk_var_comp.py]. | Program used for analysis: [https://github.com/alex1770/Covid-19/blob/master/VOCgrowth/uk_var_comp.py uk_var_comp.py]. | ||
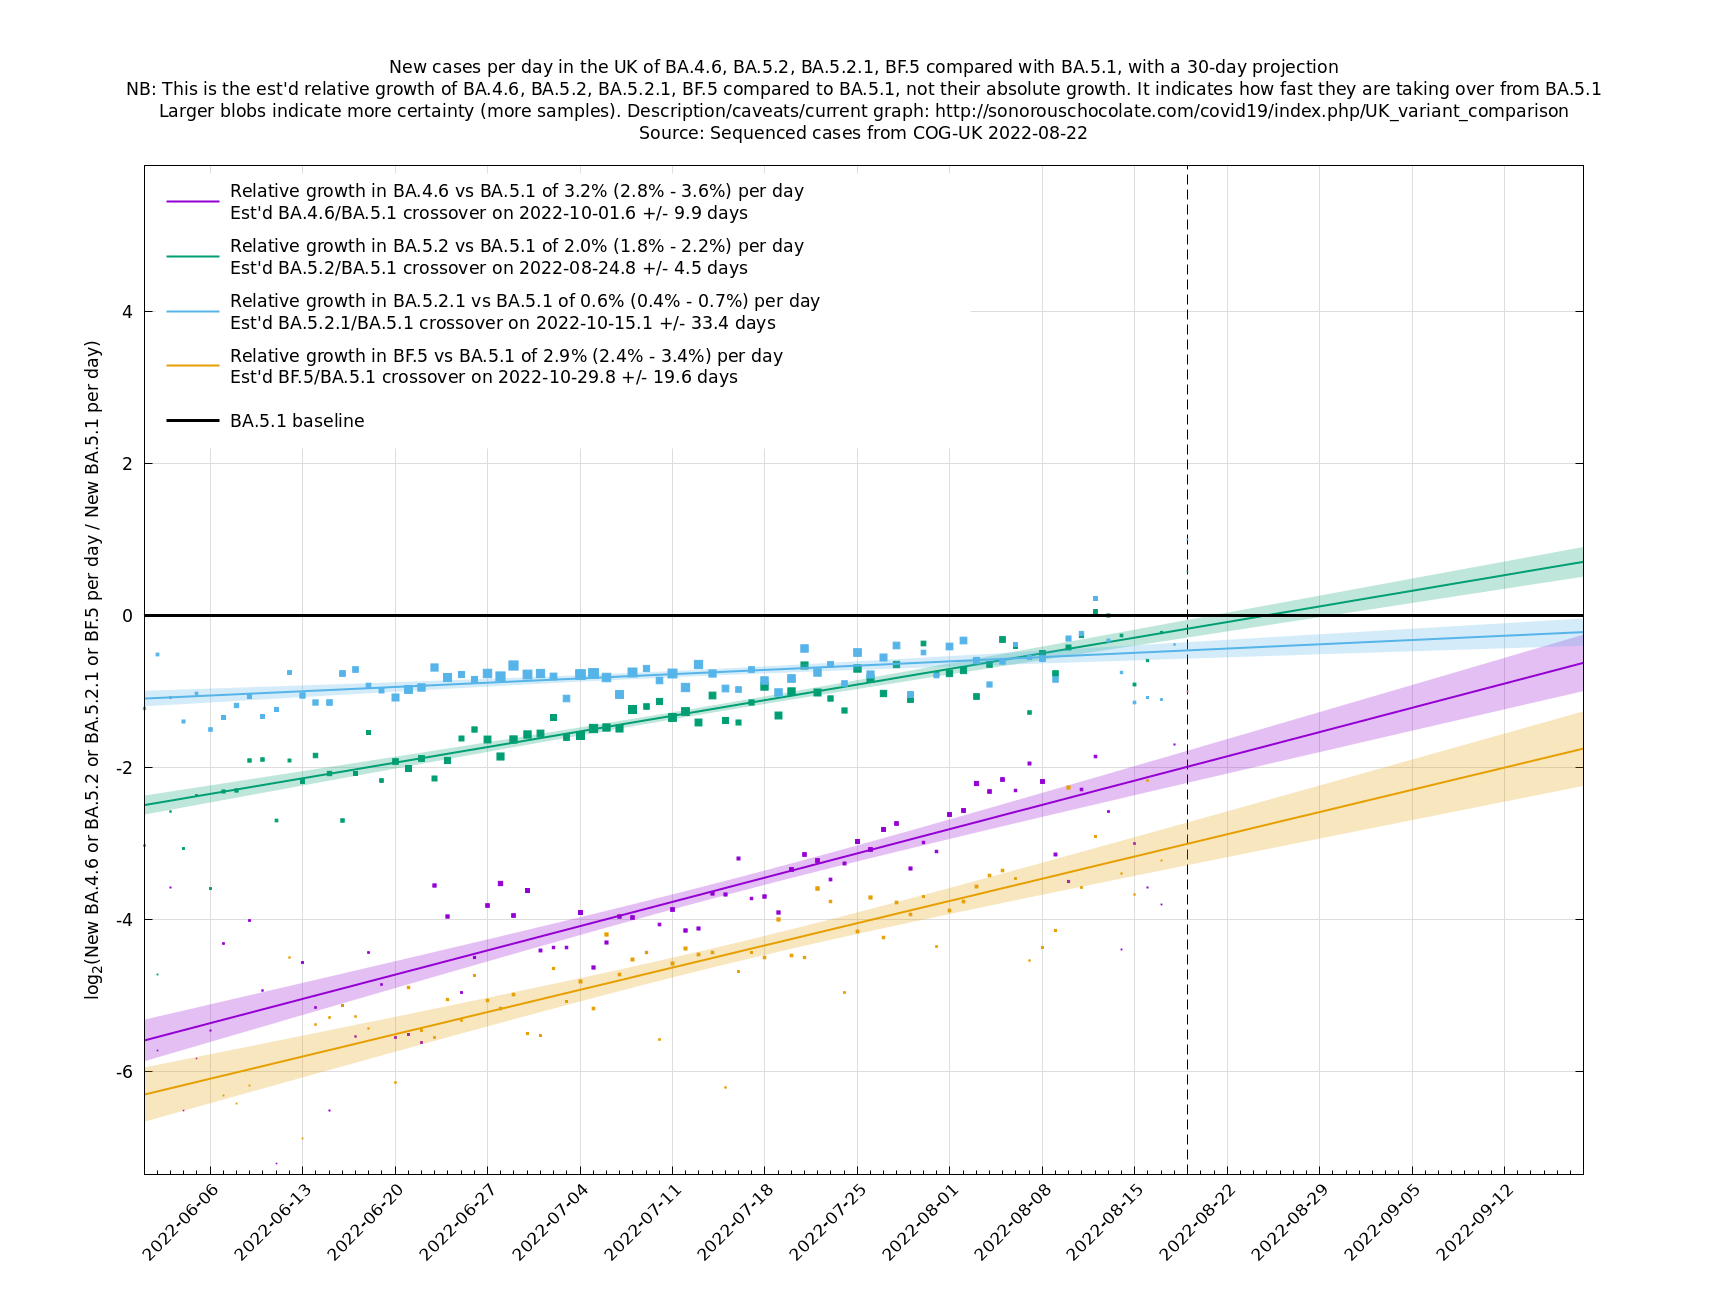
| − | Update 2022-08-02: | + | Update 2022-08-02: Adjusted the collection of main UK variants to keep an eye on to be BA.4.6, BA.5.2, BA.5.2.1, BF.5 (=BA.5.2.1.5). The strongest growing of these looks like BA.4.6 and BF.5, though BA.5.2 has enough of a head start that it will make an impact sooner. None of these look like huge threats for the next month or so as their growth advantage over the current dominant BA.5.1 is relatively modest (and their effect of BA.5.2 and BA.5.2.1 has already been priced-in to an extent), and we have a background of falling cases. However, these variants will slow down the decline in cases and may eventually lead to a resurgence later this autumn, depending on future imponderables such as the degree of waning immunity in the population, the existence/uptake of an autumn vaccine campaign and the other new variants that may appear. |
| − | |||
| + | [http://sonorouschocolate.com/covid19/extdata/UK_BA.5.1_BA.4.6_BA.5.2_BA.5.2.1_BF.5.png <img src="http://sonorouschocolate.com/covid19/extdata/UK_BA.5.1_BA.4.6_BA.5.2_BA.5.2.1_BF.5.small.png">] | ||
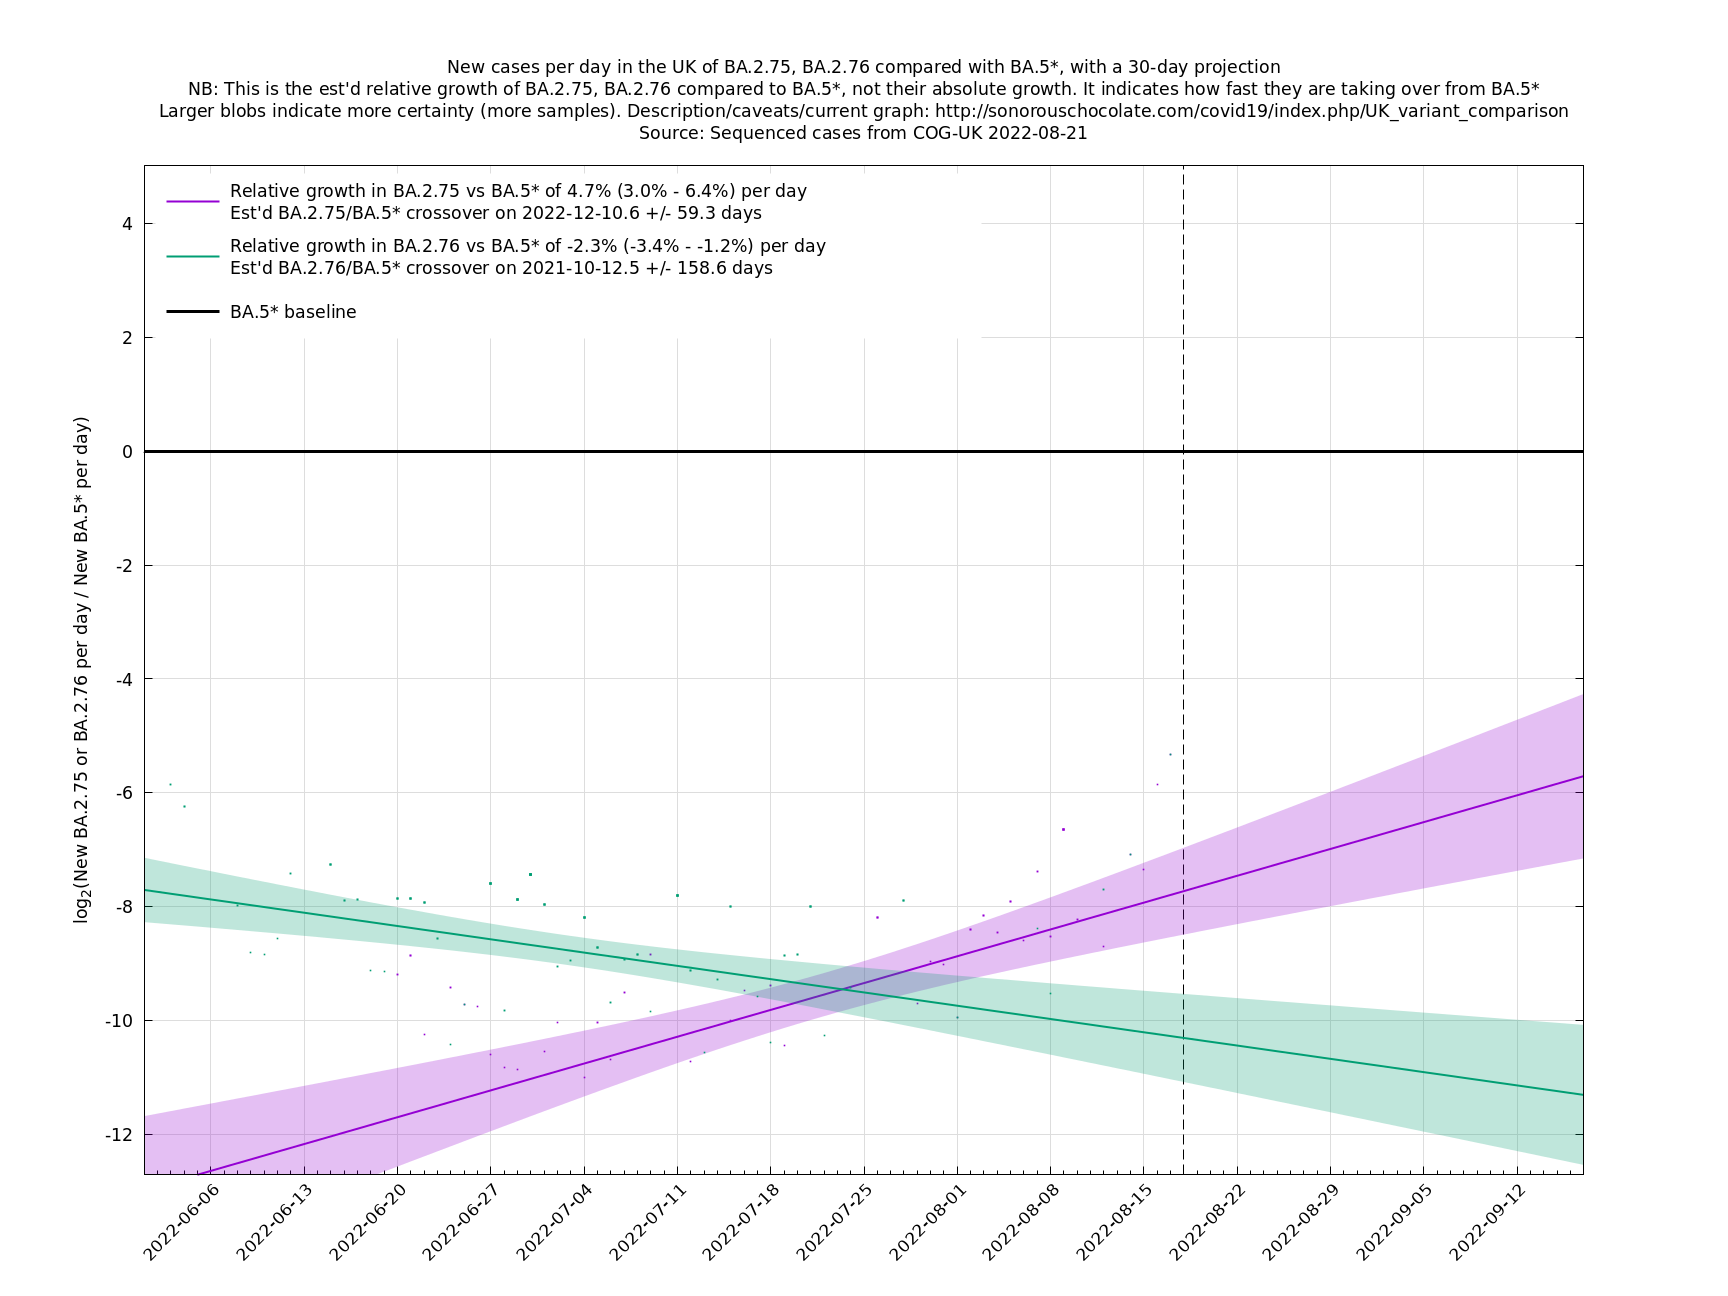
| − | BA.5 | + | Update 2022-08-02: adding a comparison of the BA.5* family with BA.2.75 (nicknamed "Centaurus") and the related BA.2.76, because there has been some concern that BA.2.75 may be a threat in some places in the world. However, BA.2.75 is not making any serious impact on cases in the UK now, nor does it seem likely to do so in the foreseeable. The top of the confidence interval for growth gives it a 4.0%/day advantage over the current mixture of BA.5 variants, but even at this rate it would take 5 months (9 doublings at log(2)/.04 days per doubling) to reach parity with BA.5*. Bearing in mind also that that is only relative growth, and BA.5* is declining at the moment, it looks like there is some safety margin for not worrying about BA.2.75 in the UK, even if the estimates are a bit off. |
| − | + | [http://sonorouschocolate.com/covid19/extdata/UK_BA.5*_BA.2.75_BA.2.76.png <img src="http://sonorouschocolate.com/covid19/extdata/UK_BA.5*_BA.2.75_BA.2.76.small.png">] | |
| − | [http://sonorouschocolate.com/covid19/extdata/UK_BA.5. | ||
= Graphs below featuring extinct or disappearing lineages are no longer updated = | = Graphs below featuring extinct or disappearing lineages are no longer updated = | ||
Revision as of 18:43, 2 August 2022
Self-updating graphs showing current situation
These graphs should auto-update every day or two, according to when there is new sequence data from COG-UK. You may need to hit shift-reload or some such to defeat your browser's cache. More recent updates appear towards the top of this page.
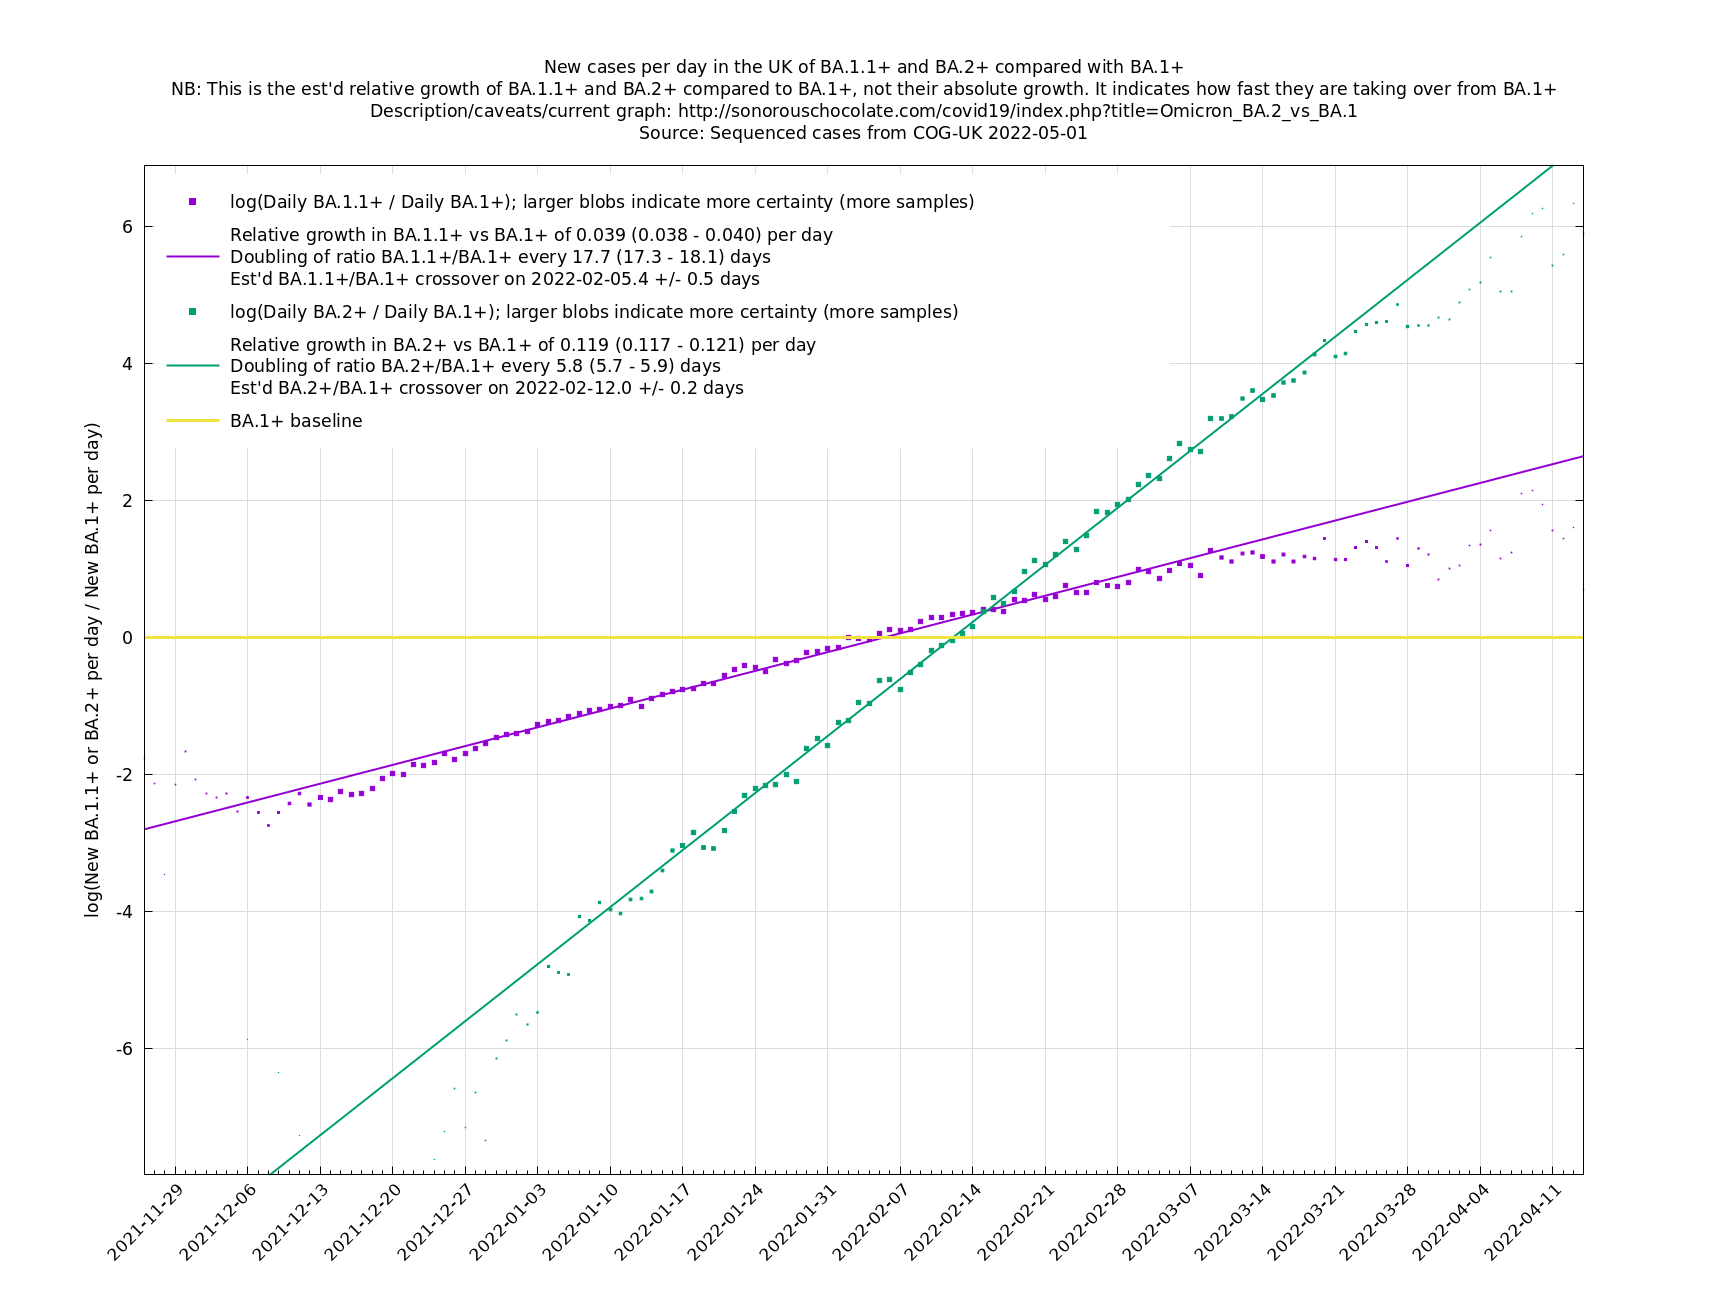
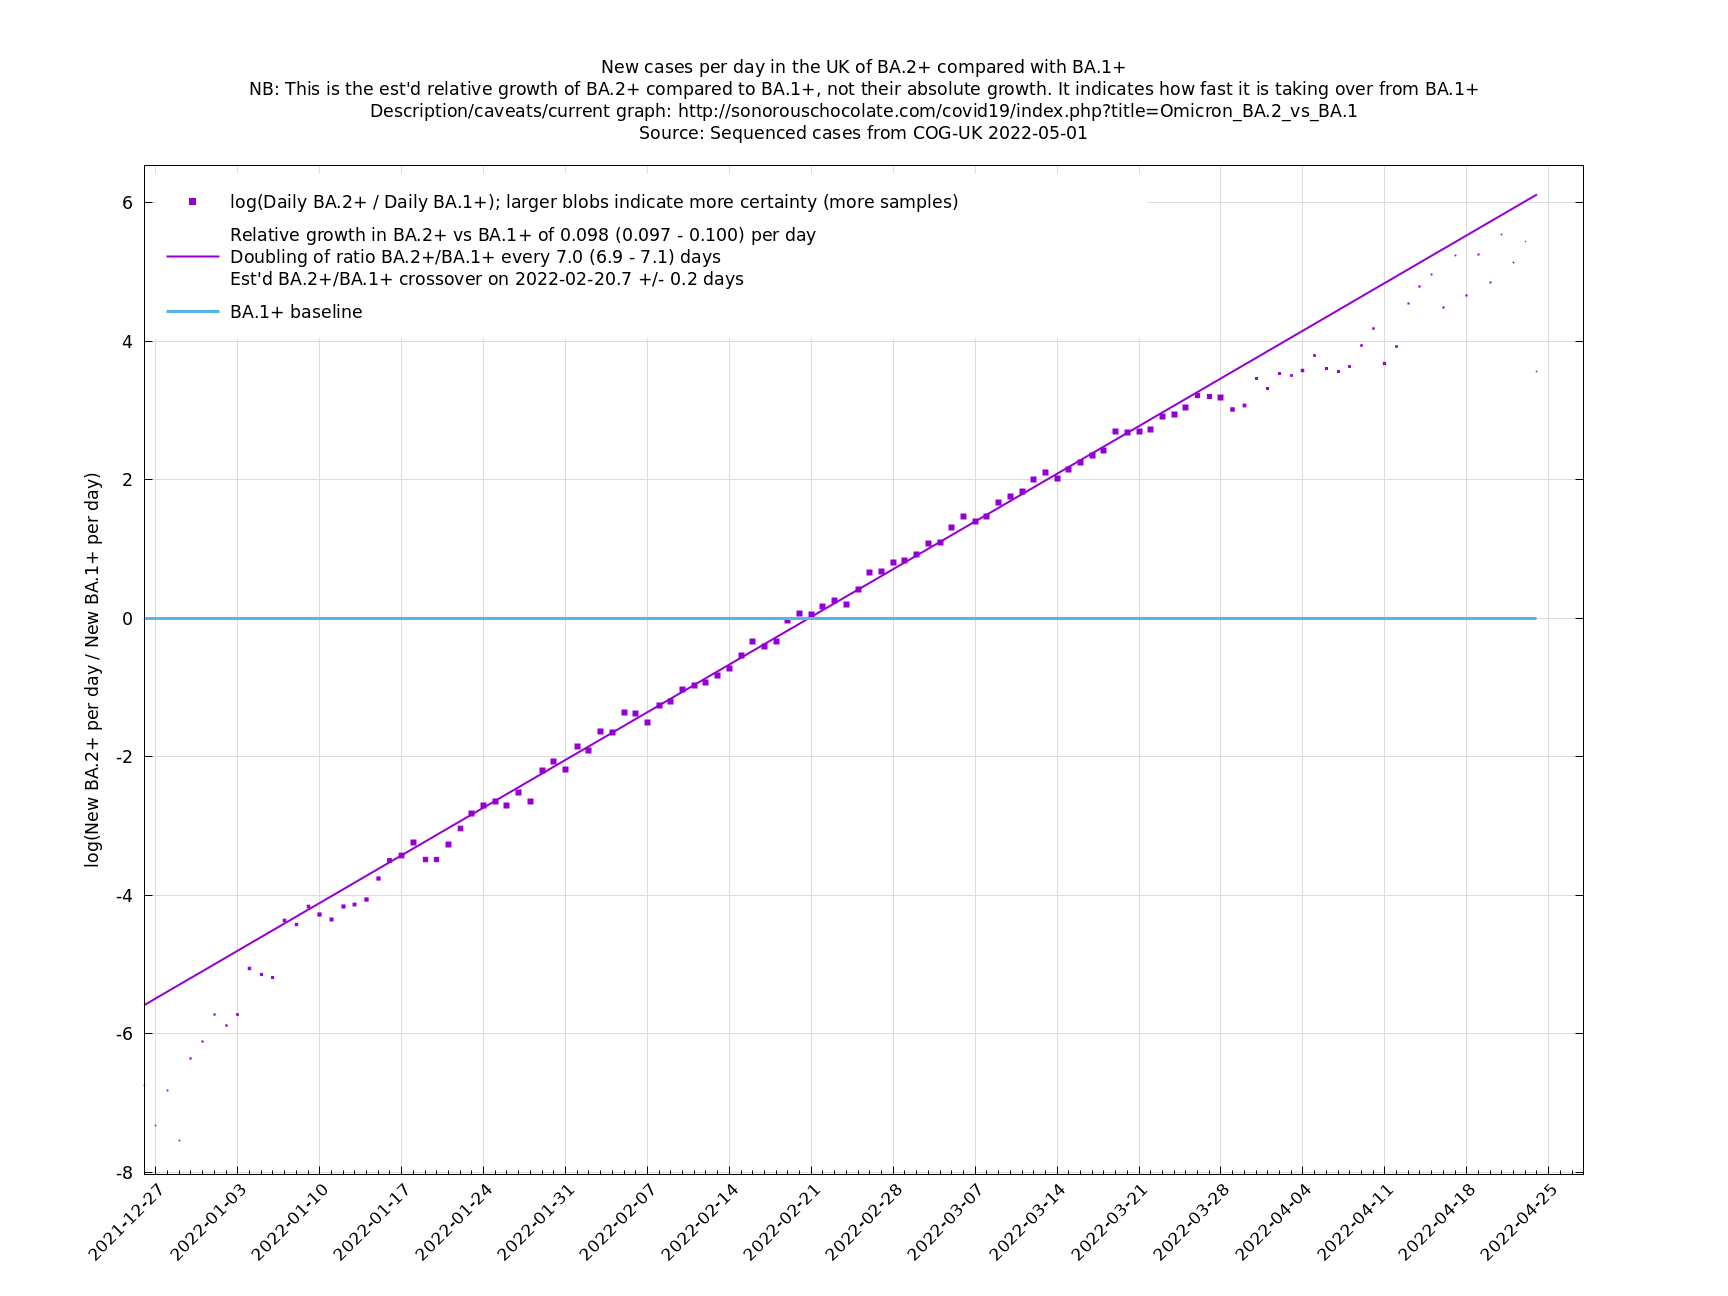
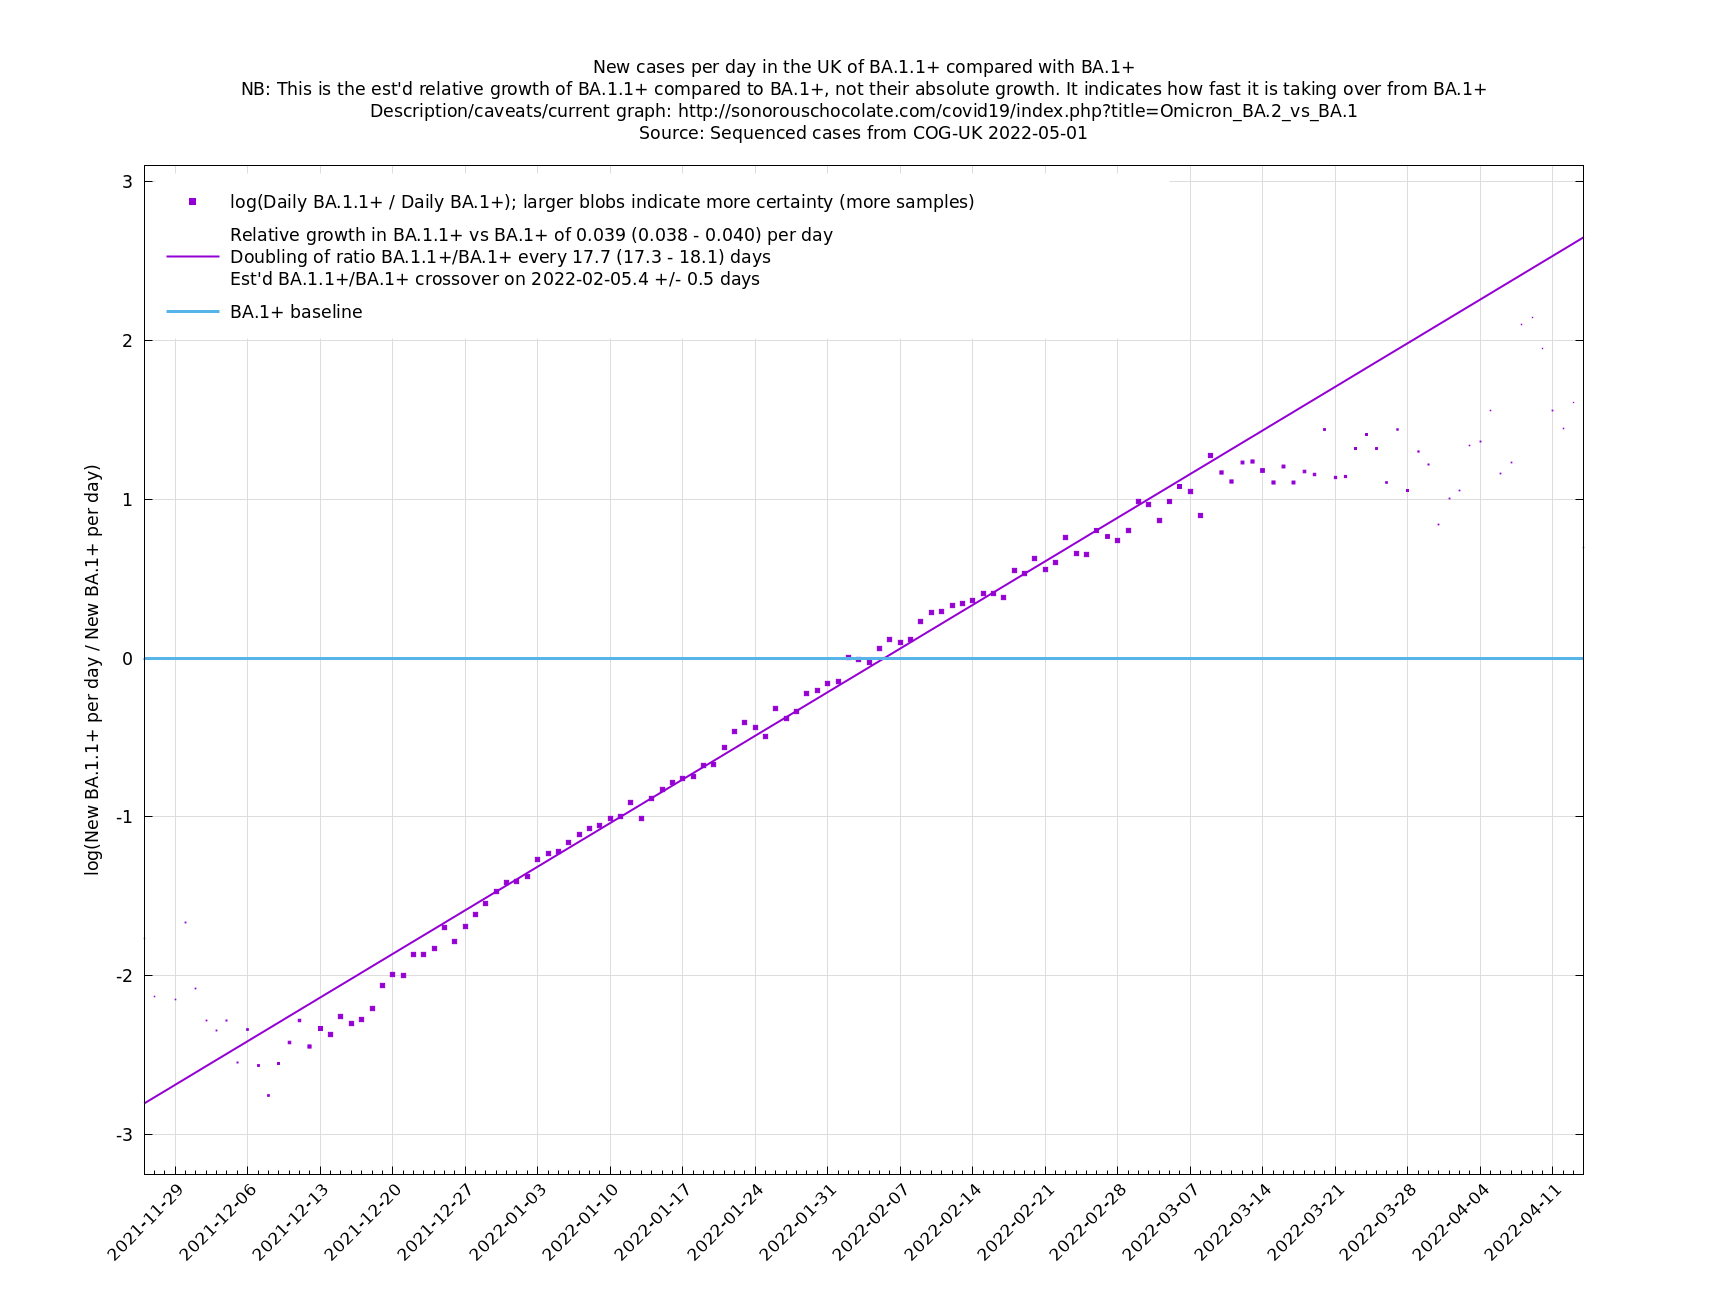
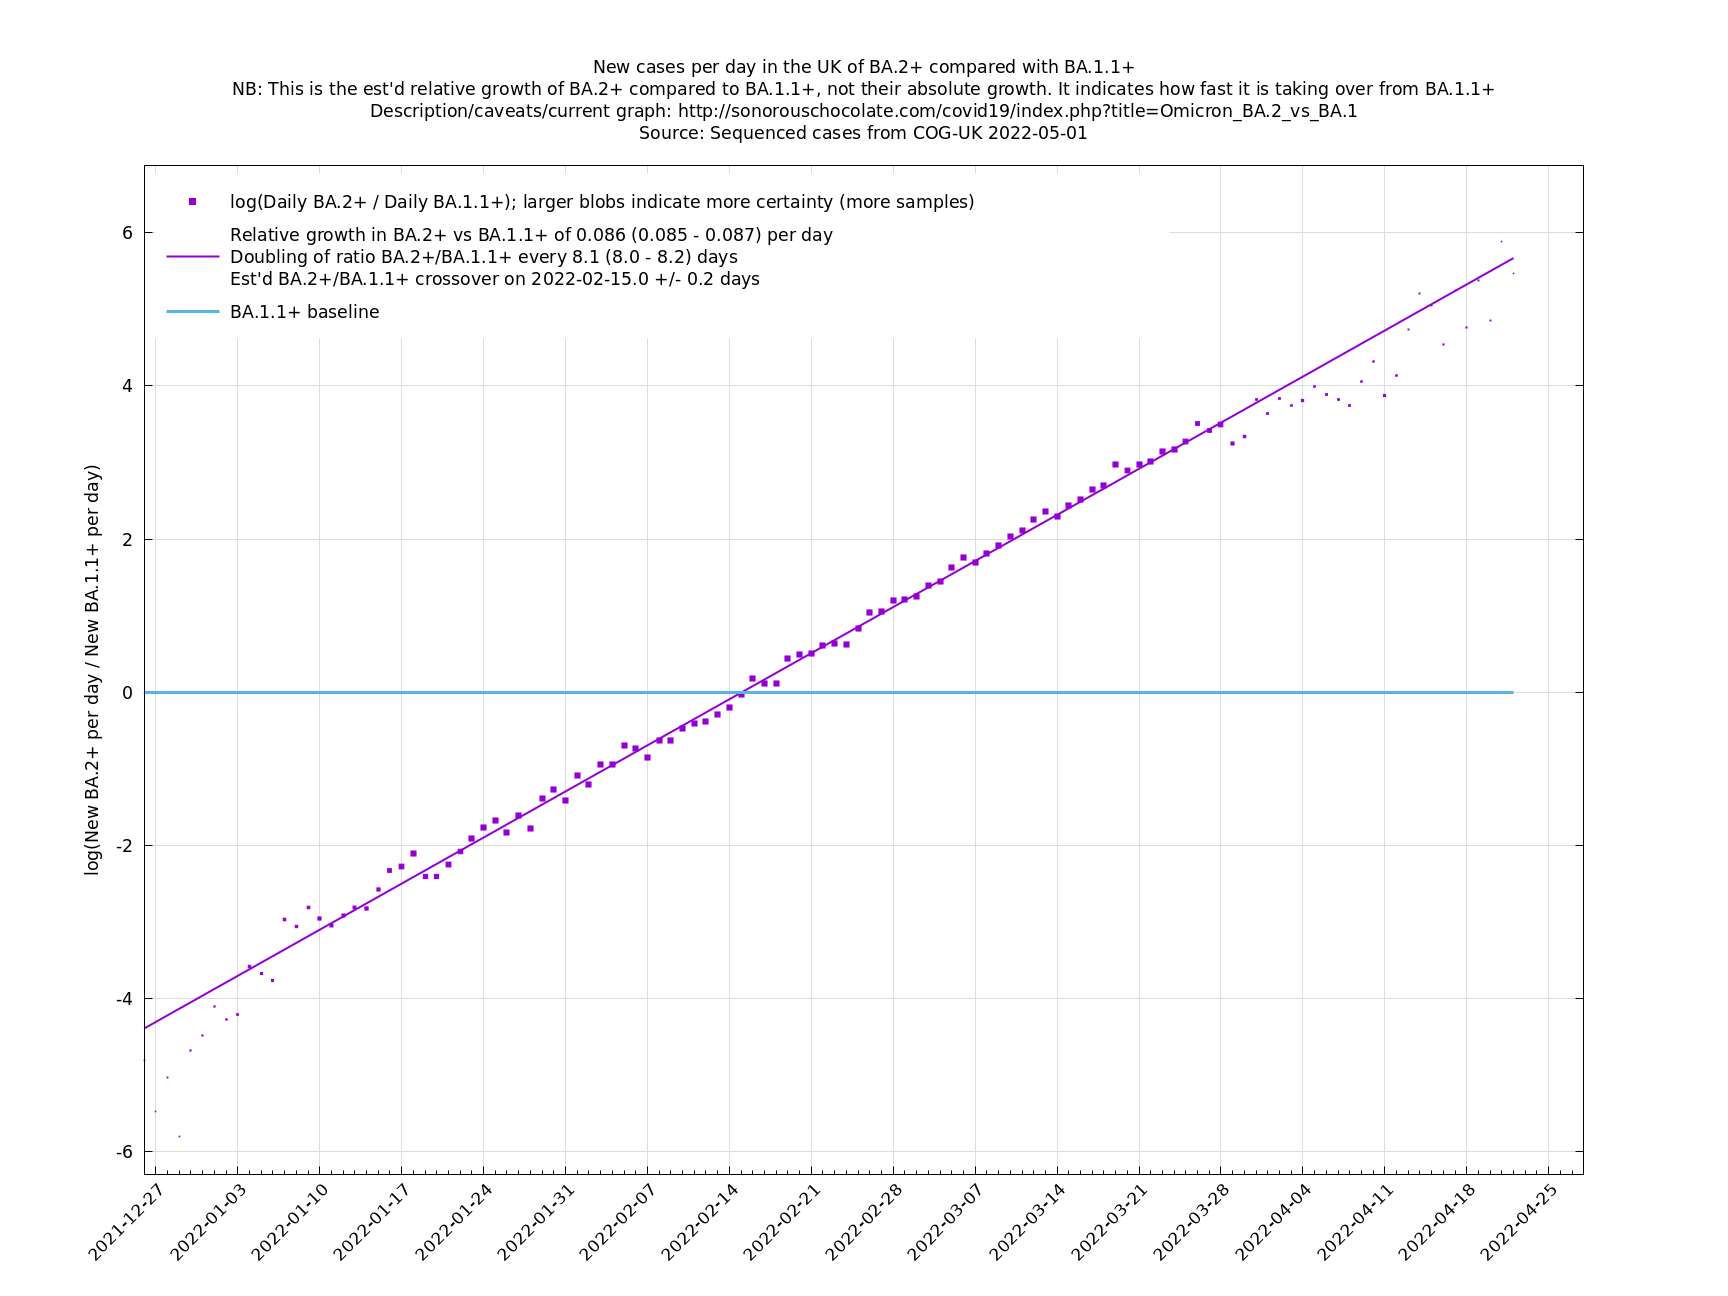
These graphs compare one or more variants with another "baseline" variant. A y-co-ordinate of 0 corresponds to equal number of new cases per day of a variant compared to the baseline variant. The purpose of presenting it this way, with a particular chosen baseline variant, as opposed to several variants on an equal footing, is that it means we expect to get straight lines to some reasonable approximation.
Note that the growth estimates here rely on sequenced cases, of which there are currently about 1,500 per day, being representative of infections. This assumption may or may not hold, though it appears to work well in many cases. We often see a good linear fit over an extended period (say, several weeks) which arguably constitutes evidence in its favour, because many distortions you may think of, such as preferential sequencing of a particular variant for a limited time period, or different growth rates in different subpopulations, or different sets of susceptible populations, would often have the effect of knocking the relationship off being linear.
Program used for analysis: uk_var_comp.py.
Update 2022-08-02: Adjusted the collection of main UK variants to keep an eye on to be BA.4.6, BA.5.2, BA.5.2.1, BF.5 (=BA.5.2.1.5). The strongest growing of these looks like BA.4.6 and BF.5, though BA.5.2 has enough of a head start that it will make an impact sooner. None of these look like huge threats for the next month or so as their growth advantage over the current dominant BA.5.1 is relatively modest (and their effect of BA.5.2 and BA.5.2.1 has already been priced-in to an extent), and we have a background of falling cases. However, these variants will slow down the decline in cases and may eventually lead to a resurgence later this autumn, depending on future imponderables such as the degree of waning immunity in the population, the existence/uptake of an autumn vaccine campaign and the other new variants that may appear.
Update 2022-08-02: adding a comparison of the BA.5* family with BA.2.75 (nicknamed "Centaurus") and the related BA.2.76, because there has been some concern that BA.2.75 may be a threat in some places in the world. However, BA.2.75 is not making any serious impact on cases in the UK now, nor does it seem likely to do so in the foreseeable. The top of the confidence interval for growth gives it a 4.0%/day advantage over the current mixture of BA.5 variants, but even at this rate it would take 5 months (9 doublings at log(2)/.04 days per doubling) to reach parity with BA.5*. Bearing in mind also that that is only relative growth, and BA.5* is declining at the moment, it looks like there is some safety margin for not worrying about BA.2.75 in the UK, even if the estimates are a bit off.
Graphs below featuring extinct or disappearing lineages are no longer updated
(Note the y-scales below use natural logs.)