Difference between revisions of "CasesByAge"
| (15 intermediate revisions by the same user not shown) | |||
| Line 1: | Line 1: | ||
__TOC__ | __TOC__ | ||
| − | |||
| − | |||
| − | |||
| − | |||
| − | |||
| − | |||
= Short explanation = | = Short explanation = | ||
| − | (These graphs should auto-update daily at around 4 | + | (These graphs should auto-update daily at around 4-5pm UK time. You may need to hit shift-reload or some such to defeat your browser's cache.) |
| − | |||
| − | |||
| − | |||
| − | |||
| − | Update on | + | * Update 1 March 2022: This graph is currently not auto-updating because it relies on published values every day, but these are no longer being supplied for the weekend (even in retrospect) owing to a change in UKHSA policy. |
| + | * Update 1 February 2022: Pausing updates to check that everything is consistent with the [https://coronavirus.data.gov.uk/details/whats-new/record/beb802ac-1ed2-47ac-b314-69a5c3f712b5 new dashboard reinfection update] | ||
| + | * Update 26 January 2022: Age bands adjusted to better represent the large number of school-age cases. | ||
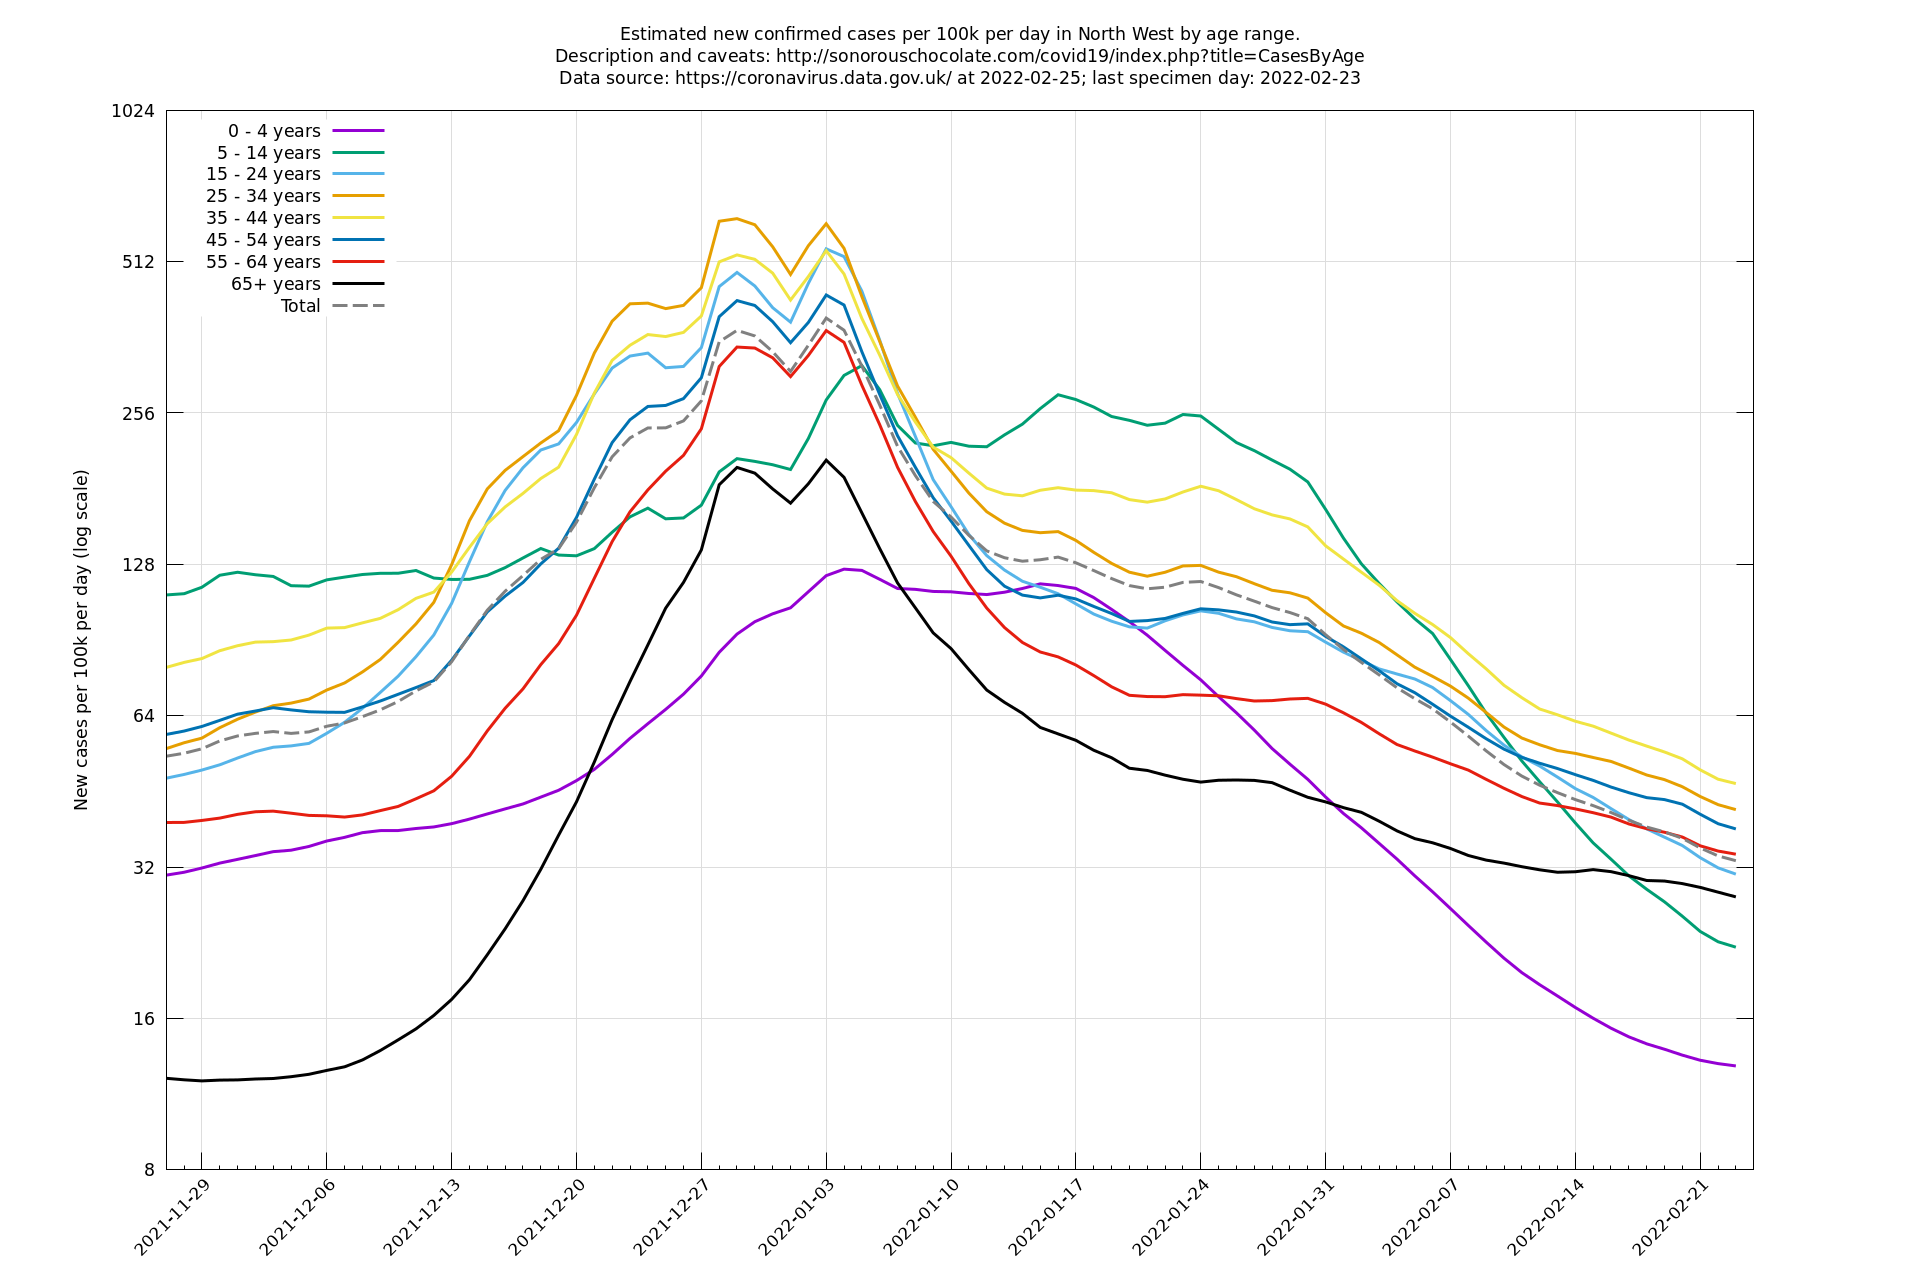
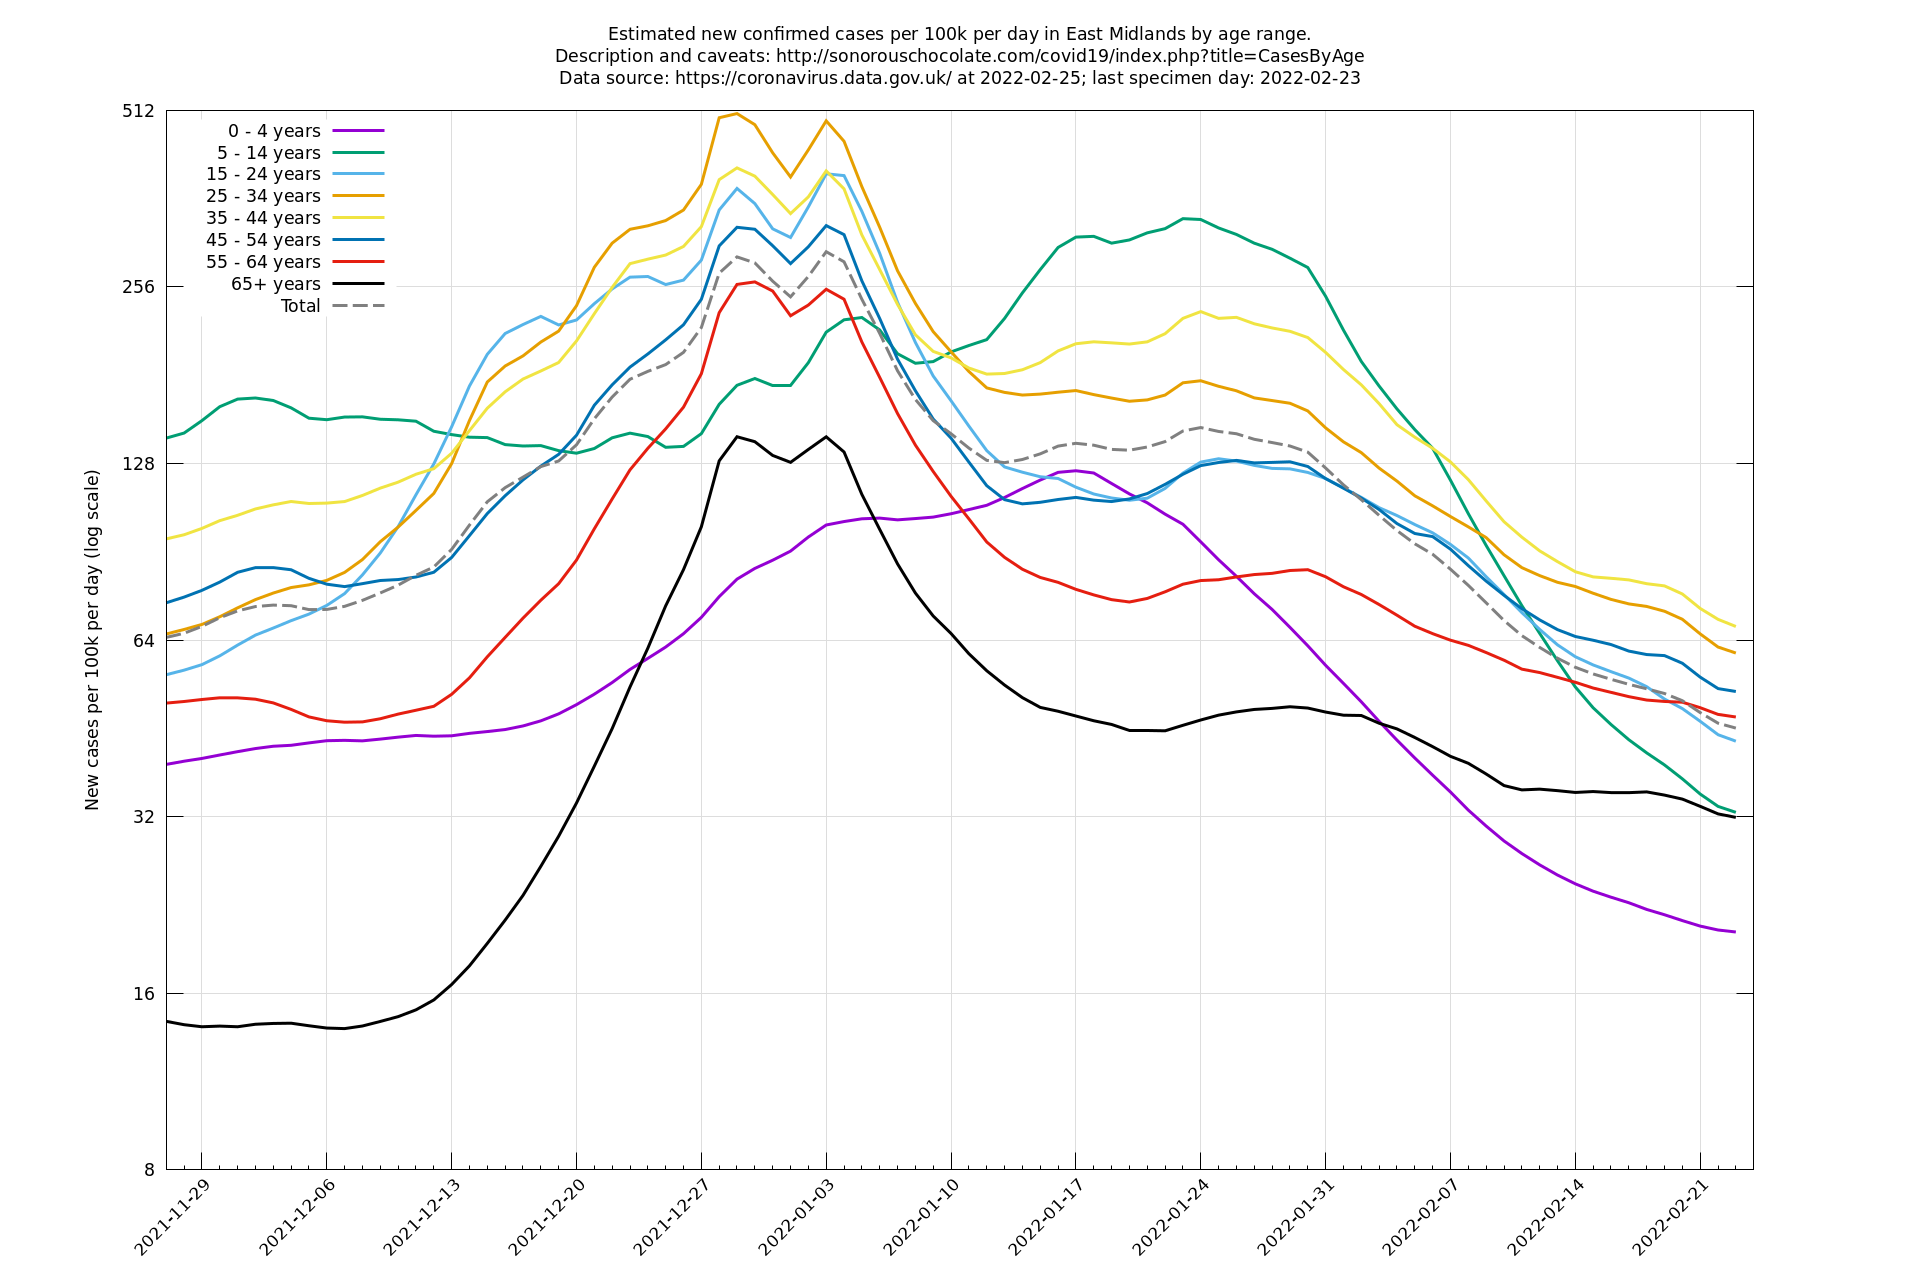
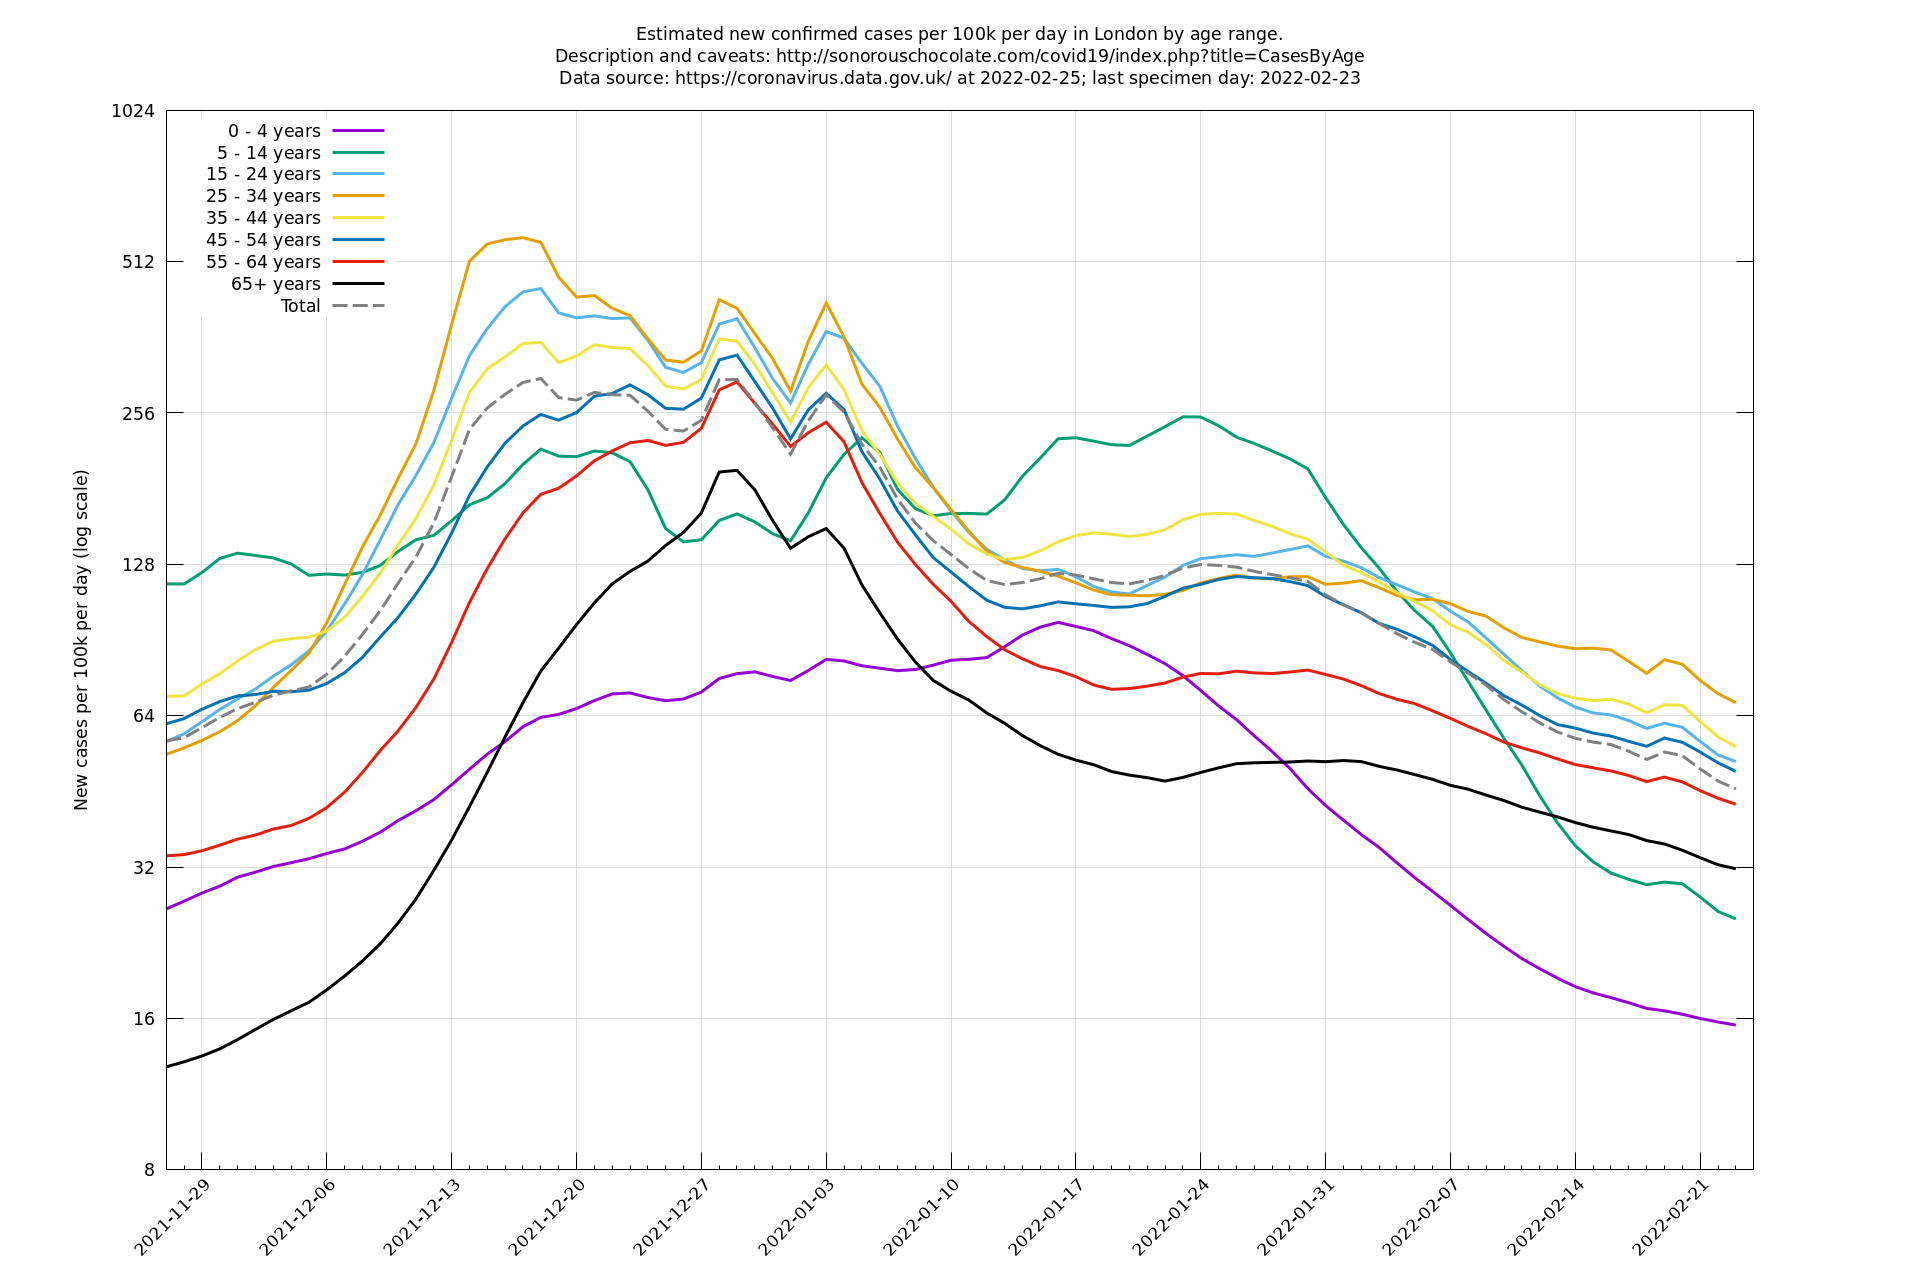
The idea of this graph is to attempt to make use of the most recent information from [https://coronavirus.data.gov.uk/details/download public data] about the number of confirmed cases in various age bands, so that trends over the last few days can hopefully be discerned. The numbers in each age band are adjusted/corrected for their incompleteness, then corrected for day-of-week biases, in both cases, as far as possible, in a non-laggy way. | The idea of this graph is to attempt to make use of the most recent information from [https://coronavirus.data.gov.uk/details/download public data] about the number of confirmed cases in various age bands, so that trends over the last few days can hopefully be discerned. The numbers in each age band are adjusted/corrected for their incompleteness, then corrected for day-of-week biases, in both cases, as far as possible, in a non-laggy way. | ||
| − | + | The value of this approach is that it can show trends ahead of many other indicators, and in a reasonably clear way without the day-of-week effects muddling it up. On the other hand, the possible weakness is that it relies on case counts being a reliable indicator of the number of infections, which would cease to be true if people changed their willingness to get tested or our testing system were overloaded. As of 22 December 2021, it's my opinion that the testing system is showing signs of strain but is broadly speaking holding up. This proposition will eventually be checked one way or another by infection survey data. | |
Note that, as a consequence of the last few days' information being incomplete, the case number estimate for these days can sometimes be retrospectively updated over the next day or two. | Note that, as a consequence of the last few days' information being incomplete, the case number estimate for these days can sometimes be retrospectively updated over the next day or two. | ||
Program: https://github.com/alex1770/Covid-19/blob/master/casesbyage.py | Program: https://github.com/alex1770/Covid-19/blob/master/casesbyage.py | ||
| + | |||
| + | = England = | ||
| + | |||
| + | [http://sonorouschocolate.com/covid19/extdata/casesbyageregion/England.png <img src="http://sonorouschocolate.com/covid19/extdata/casesbyageregion/England.medium.png">] | ||
| + | |||
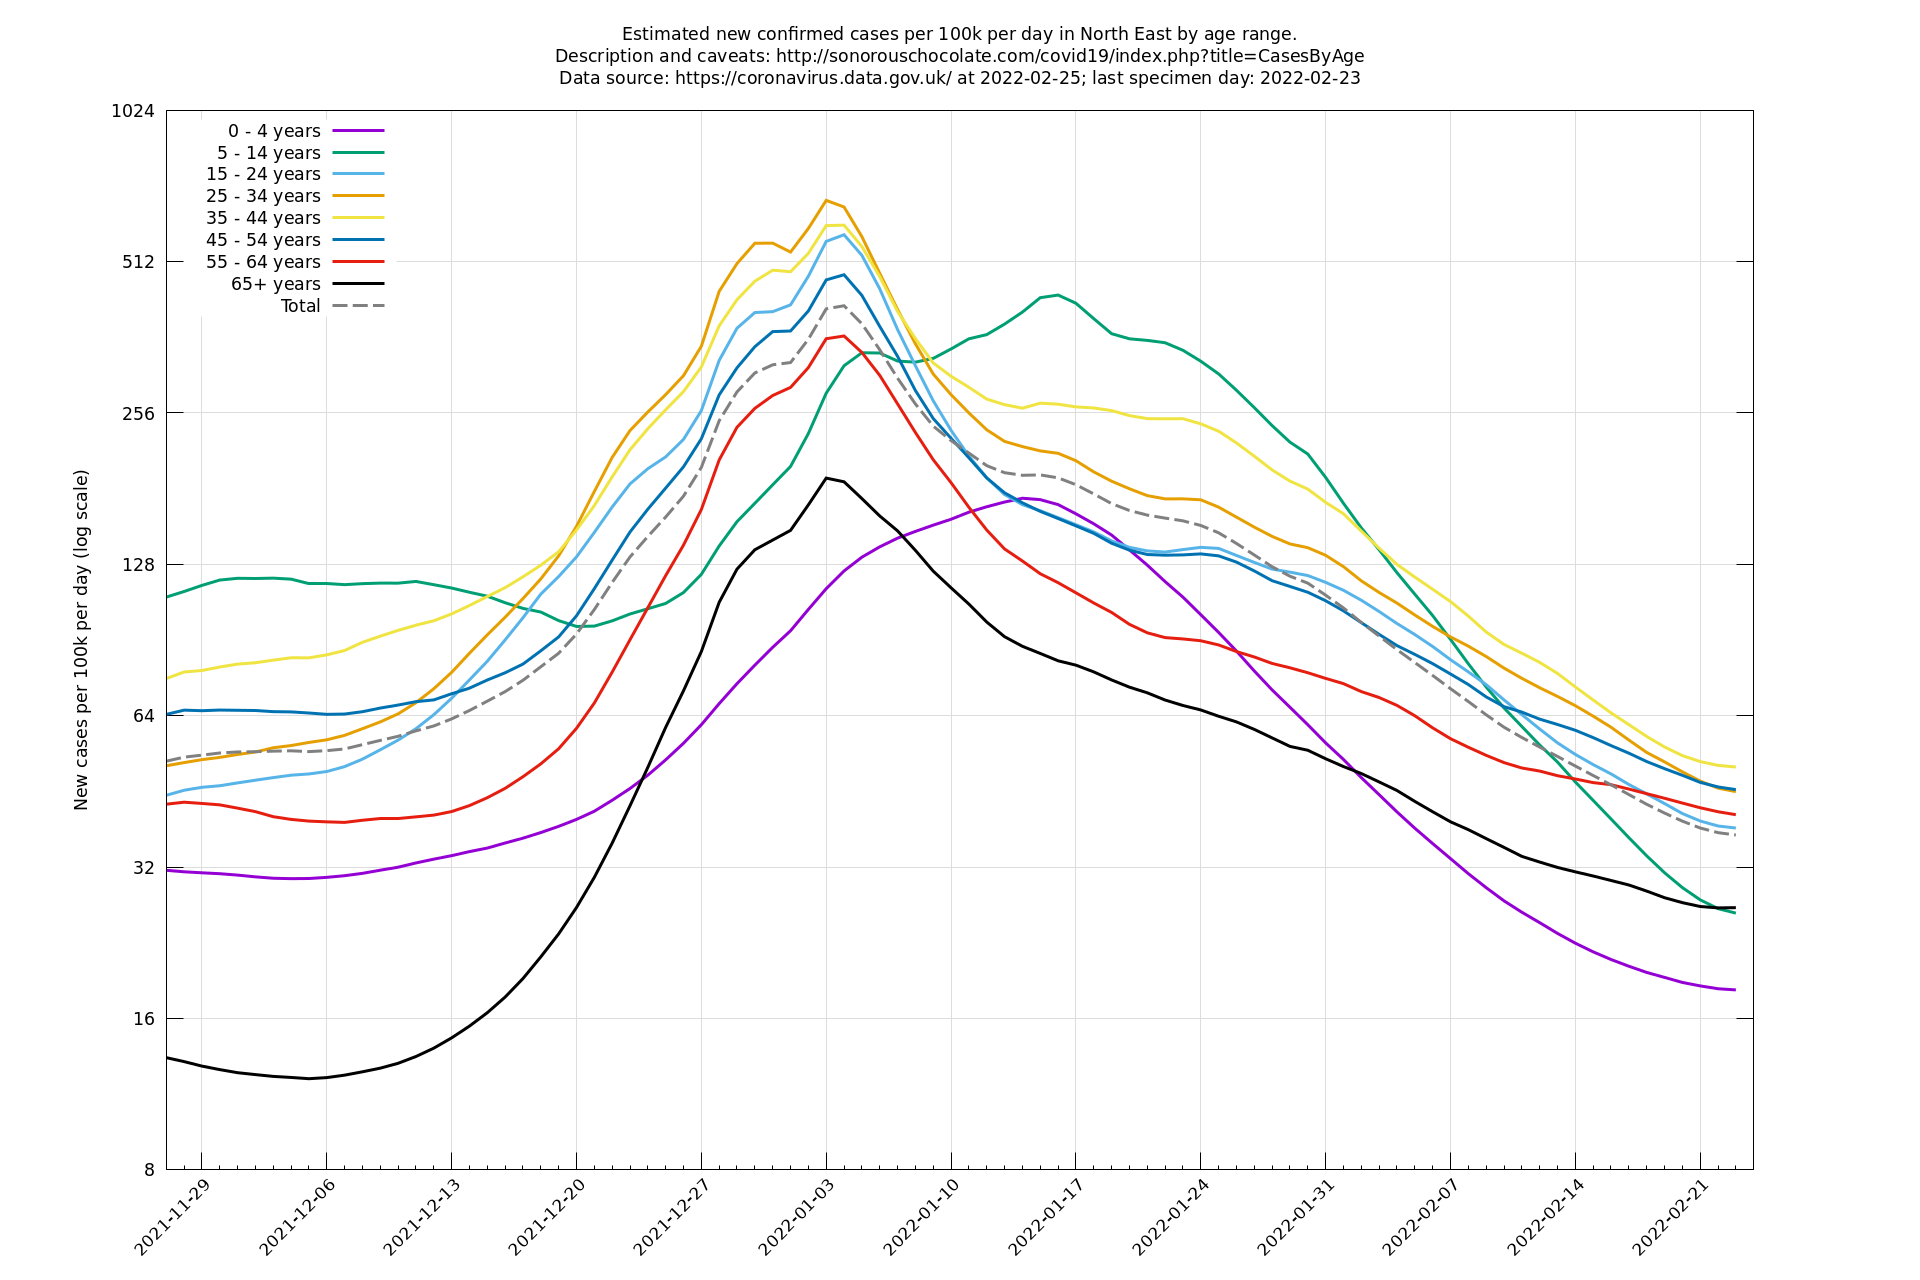
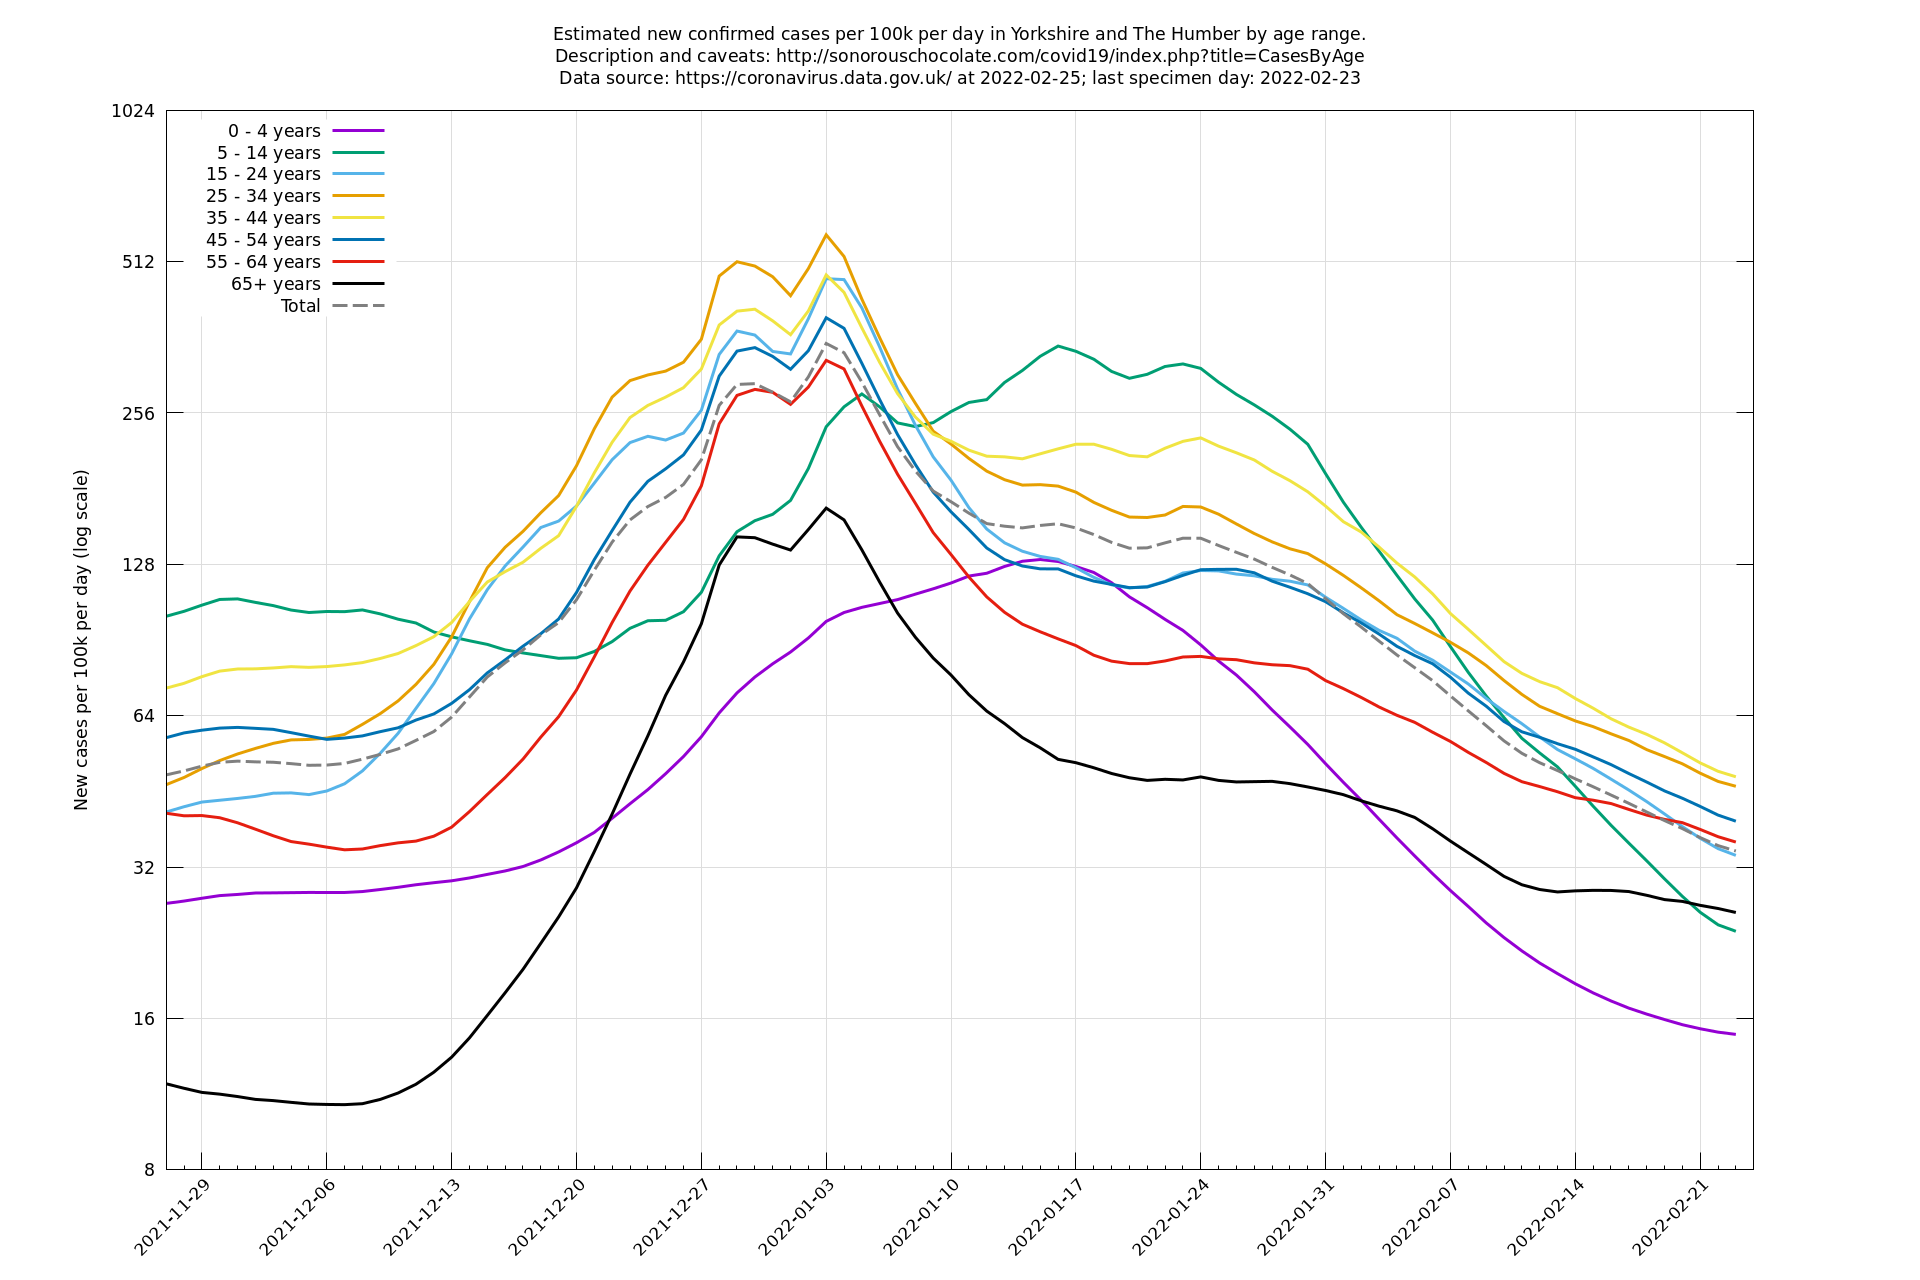
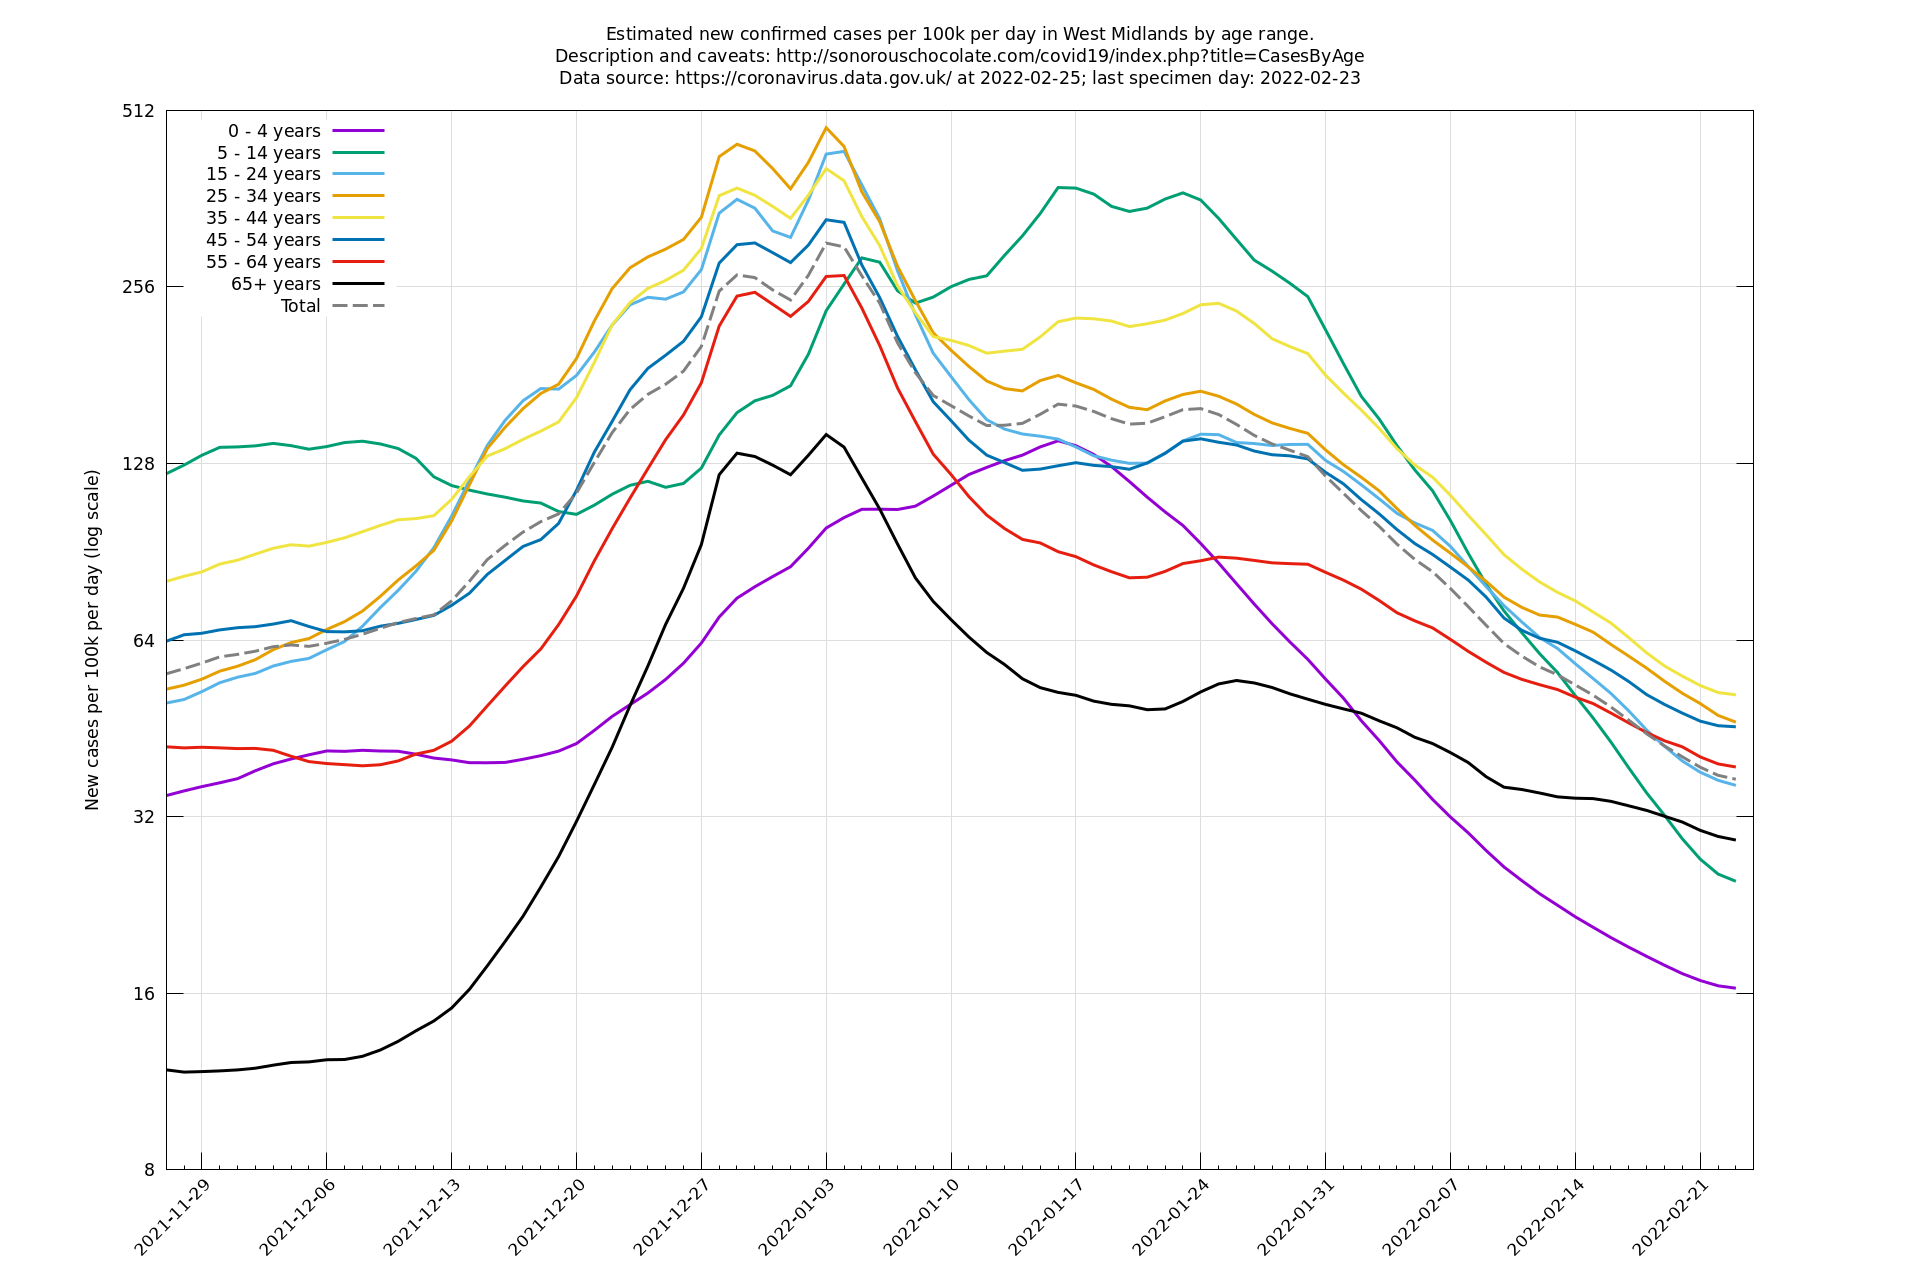
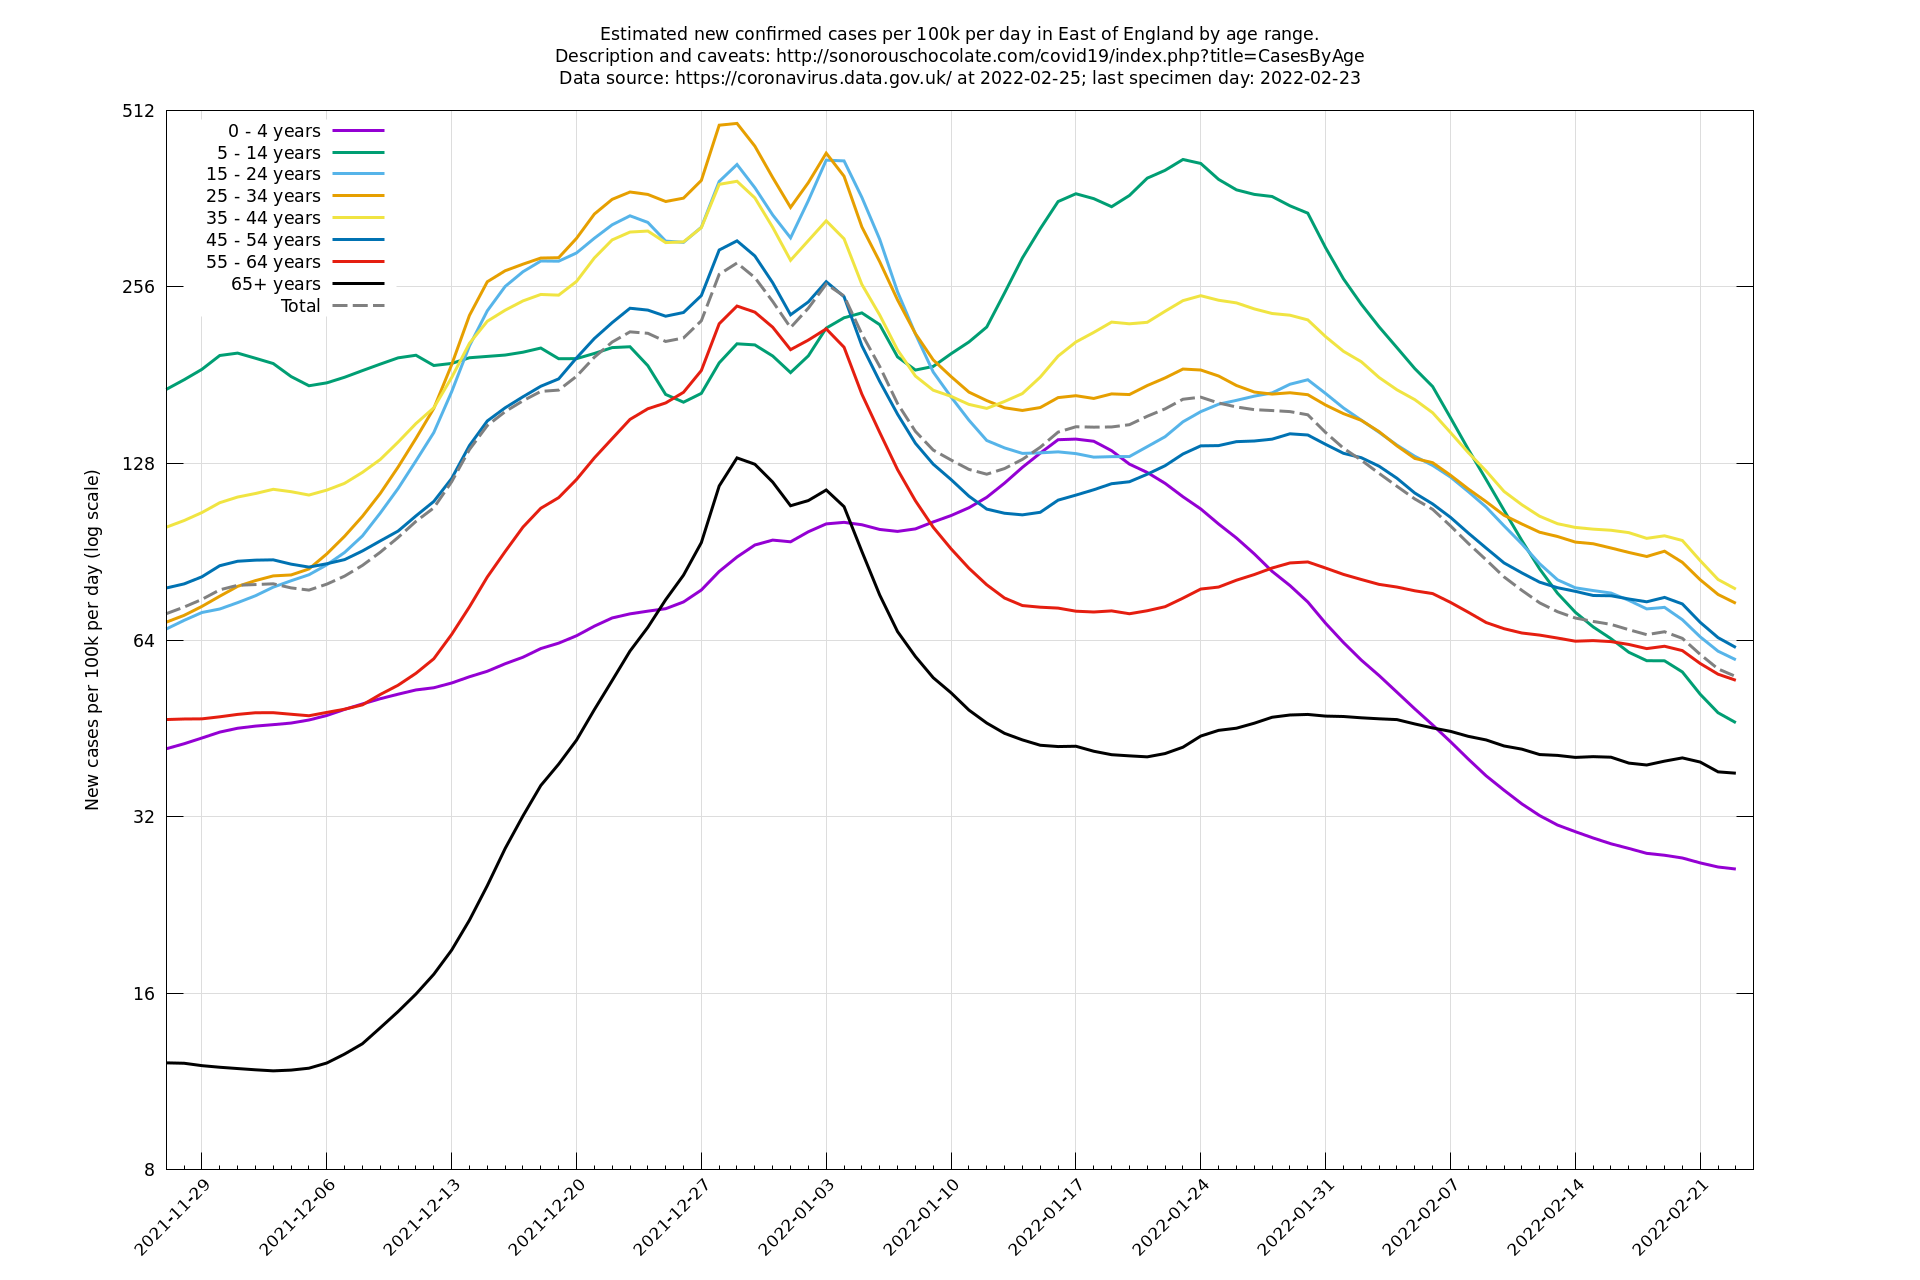
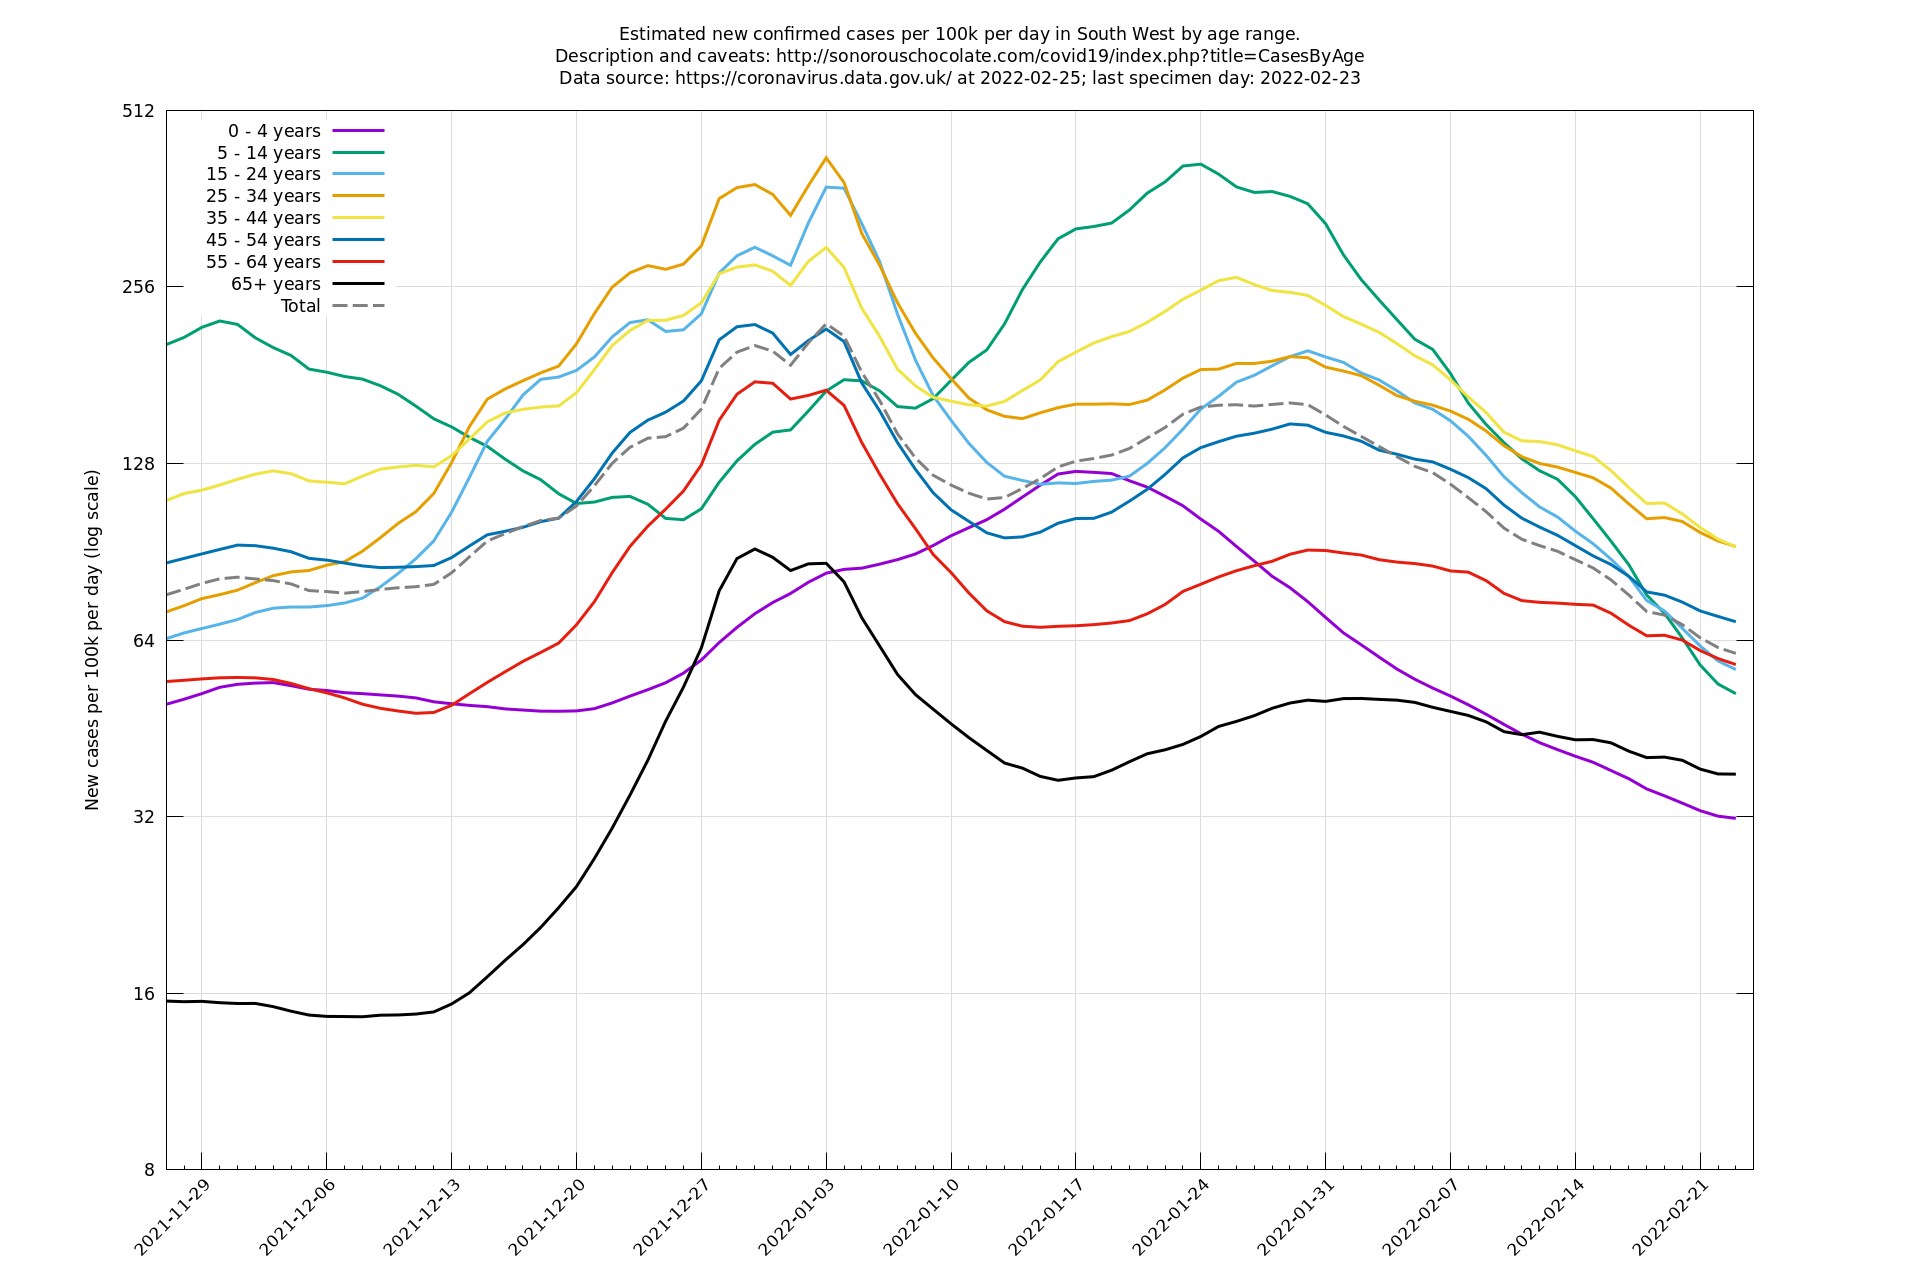
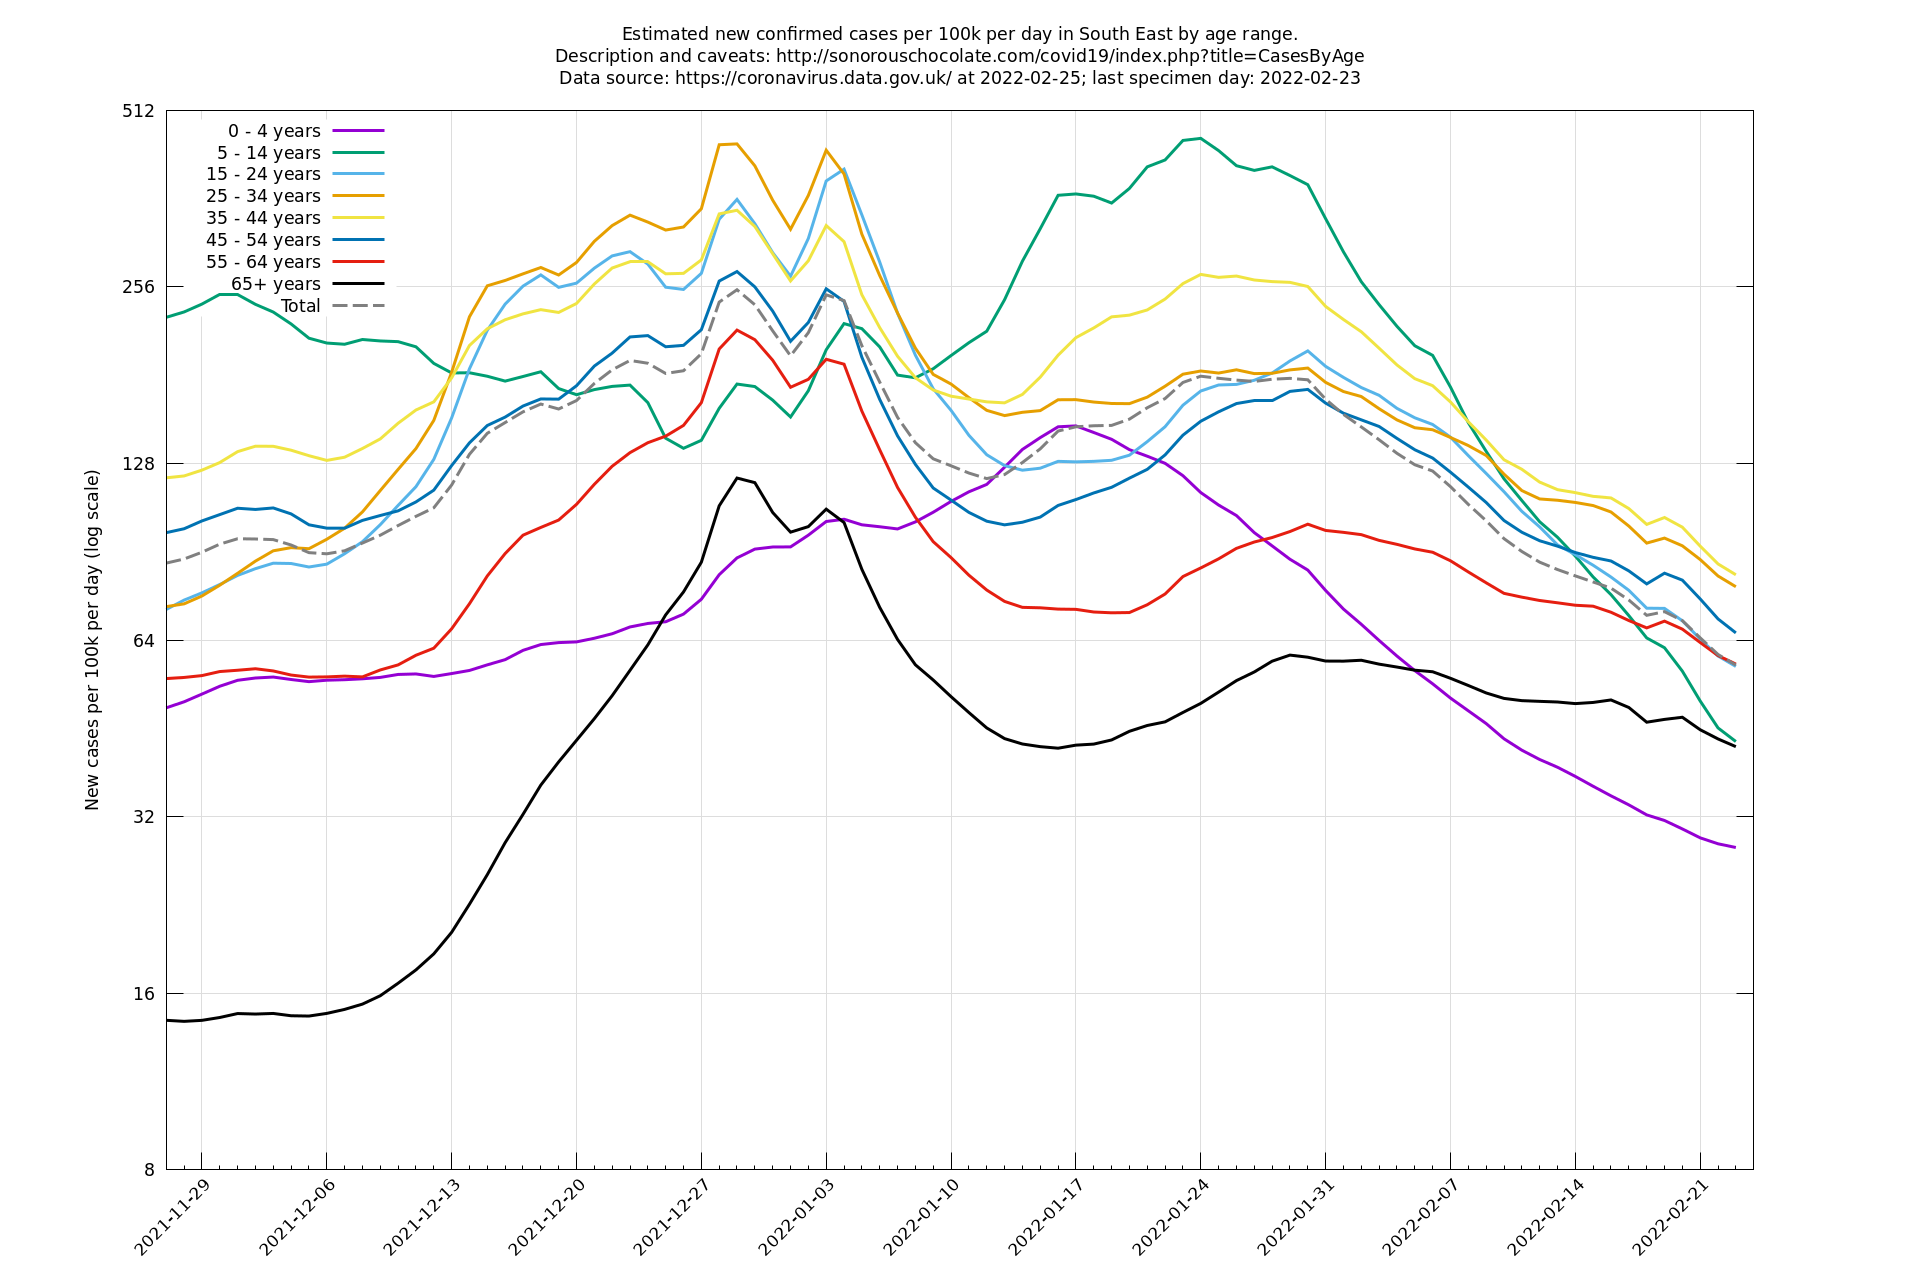
= Regions of England = | = Regions of England = | ||
| − | [http://sonorouschocolate.com/covid19/extdata/casesbyageregion/North_West | + | [http://sonorouschocolate.com/covid19/extdata/casesbyageregion/North_West.png <img src="http://sonorouschocolate.com/covid19/extdata/casesbyageregion/North_West.small.png">] |
| − | [http://sonorouschocolate.com/covid19/extdata/casesbyageregion/North_East | + | [http://sonorouschocolate.com/covid19/extdata/casesbyageregion/North_East.png <img src="http://sonorouschocolate.com/covid19/extdata/casesbyageregion/North_East.small.png">] |
| − | [http://sonorouschocolate.com/covid19/extdata/casesbyageregion/Yorkshire_and_The_Humber | + | [http://sonorouschocolate.com/covid19/extdata/casesbyageregion/Yorkshire_and_The_Humber.png <img src="http://sonorouschocolate.com/covid19/extdata/casesbyageregion/Yorkshire_and_The_Humber.small.png">] |
| − | [http://sonorouschocolate.com/covid19/extdata/casesbyageregion/West_Midlands | + | [http://sonorouschocolate.com/covid19/extdata/casesbyageregion/West_Midlands.png <img src="http://sonorouschocolate.com/covid19/extdata/casesbyageregion/West_Midlands.small.png">] |
| − | [http://sonorouschocolate.com/covid19/extdata/casesbyageregion/East_Midlands | + | [http://sonorouschocolate.com/covid19/extdata/casesbyageregion/East_Midlands.png <img src="http://sonorouschocolate.com/covid19/extdata/casesbyageregion/East_Midlands.small.png">] |
| − | [http://sonorouschocolate.com/covid19/extdata/casesbyageregion/East_of_England | + | [http://sonorouschocolate.com/covid19/extdata/casesbyageregion/East_of_England.png <img src="http://sonorouschocolate.com/covid19/extdata/casesbyageregion/East_of_England.small.png">] |
| − | [http://sonorouschocolate.com/covid19/extdata/casesbyageregion/South_West | + | [http://sonorouschocolate.com/covid19/extdata/casesbyageregion/South_West.png <img src="http://sonorouschocolate.com/covid19/extdata/casesbyageregion/South_West.small.png">] |
| − | [http://sonorouschocolate.com/covid19/extdata/casesbyageregion/South_East | + | [http://sonorouschocolate.com/covid19/extdata/casesbyageregion/South_East.png <img src="http://sonorouschocolate.com/covid19/extdata/casesbyageregion/South_East.small.png">] |
| − | [http://sonorouschocolate.com/covid19/extdata/casesbyageregion/London | + | [http://sonorouschocolate.com/covid19/extdata/casesbyageregion/London.png <img src="http://sonorouschocolate.com/covid19/extdata/casesbyageregion/London.small.png">] |
Latest revision as of 12:08, 3 March 2022
Short explanation
(These graphs should auto-update daily at around 4-5pm UK time. You may need to hit shift-reload or some such to defeat your browser's cache.)
- Update 1 March 2022: This graph is currently not auto-updating because it relies on published values every day, but these are no longer being supplied for the weekend (even in retrospect) owing to a change in UKHSA policy.
- Update 1 February 2022: Pausing updates to check that everything is consistent with the new dashboard reinfection update
- Update 26 January 2022: Age bands adjusted to better represent the large number of school-age cases.
The idea of this graph is to attempt to make use of the most recent information from public data about the number of confirmed cases in various age bands, so that trends over the last few days can hopefully be discerned. The numbers in each age band are adjusted/corrected for their incompleteness, then corrected for day-of-week biases, in both cases, as far as possible, in a non-laggy way.
The value of this approach is that it can show trends ahead of many other indicators, and in a reasonably clear way without the day-of-week effects muddling it up. On the other hand, the possible weakness is that it relies on case counts being a reliable indicator of the number of infections, which would cease to be true if people changed their willingness to get tested or our testing system were overloaded. As of 22 December 2021, it's my opinion that the testing system is showing signs of strain but is broadly speaking holding up. This proposition will eventually be checked one way or another by infection survey data.
Note that, as a consequence of the last few days' information being incomplete, the case number estimate for these days can sometimes be retrospectively updated over the next day or two.
Program: https://github.com/alex1770/Covid-19/blob/master/casesbyage.py
England

Regions of England