Trendgraphs
Jump to navigation
Jump to search
About
Note: In the case of Sweden the last 7 days are not shown here because their case and death numbers are retrospectively updated for around 7 days after they are published (possibly longer). In the case of deaths this is due to them being given by date of occurrence rather than by reporting date. There is also some retrospective increase in case numbers, though possibly for a different reason. There is an additional lag between Saturday and Monday due to the official figures only being reported between Tuesday and Friday.
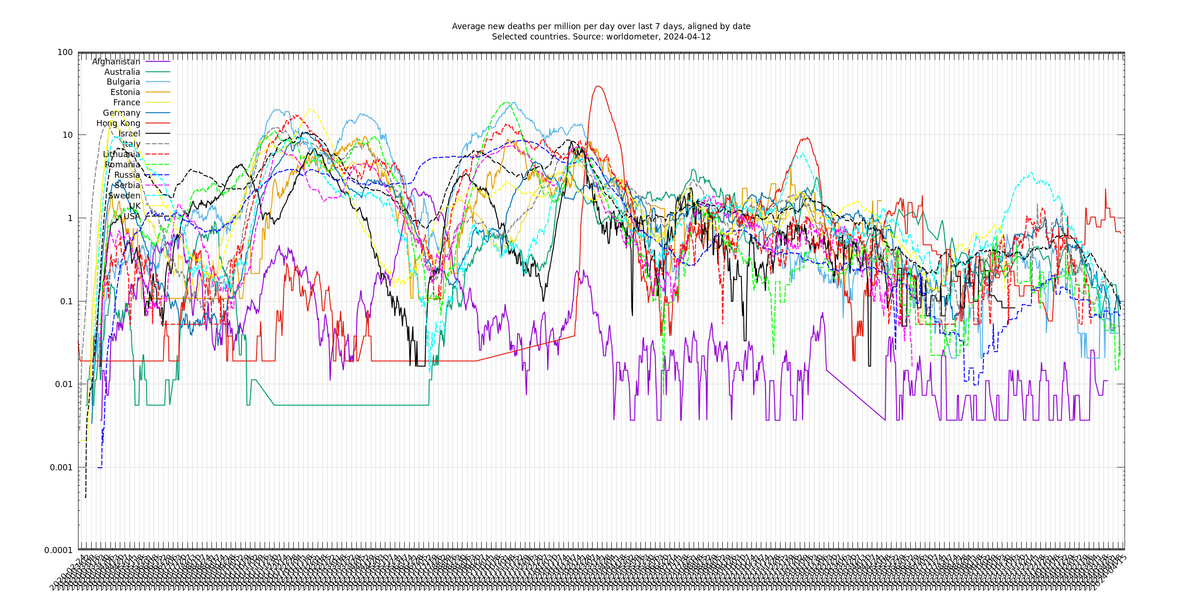
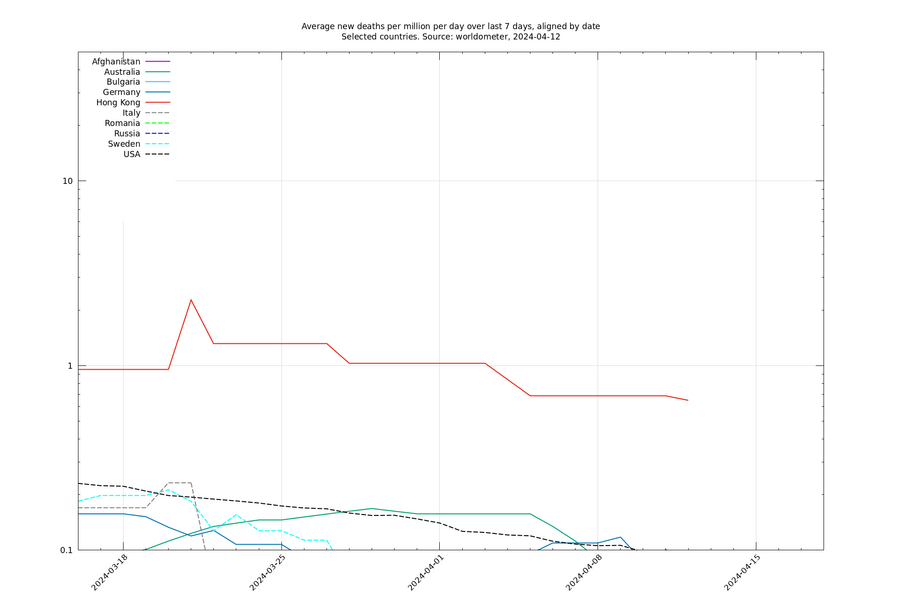
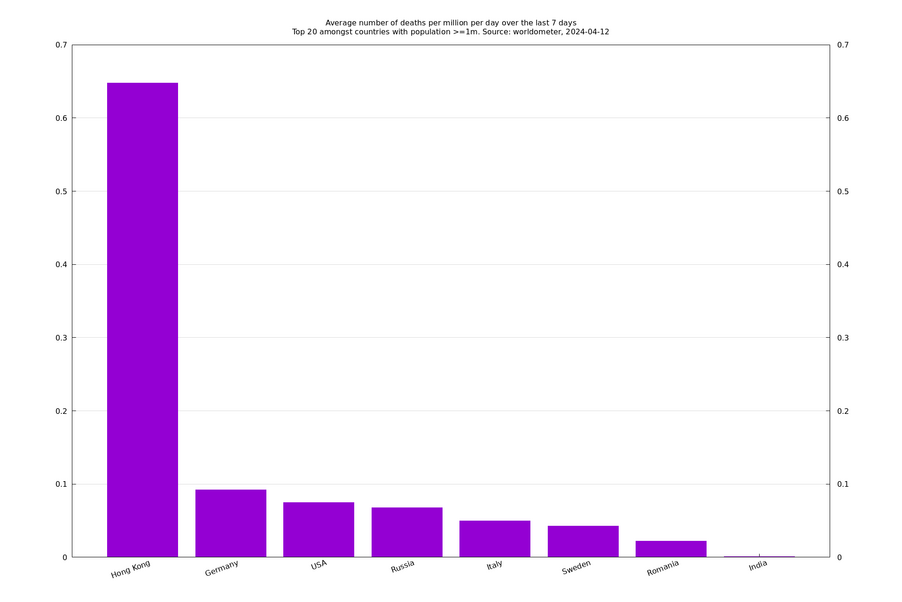
Trend in deaths
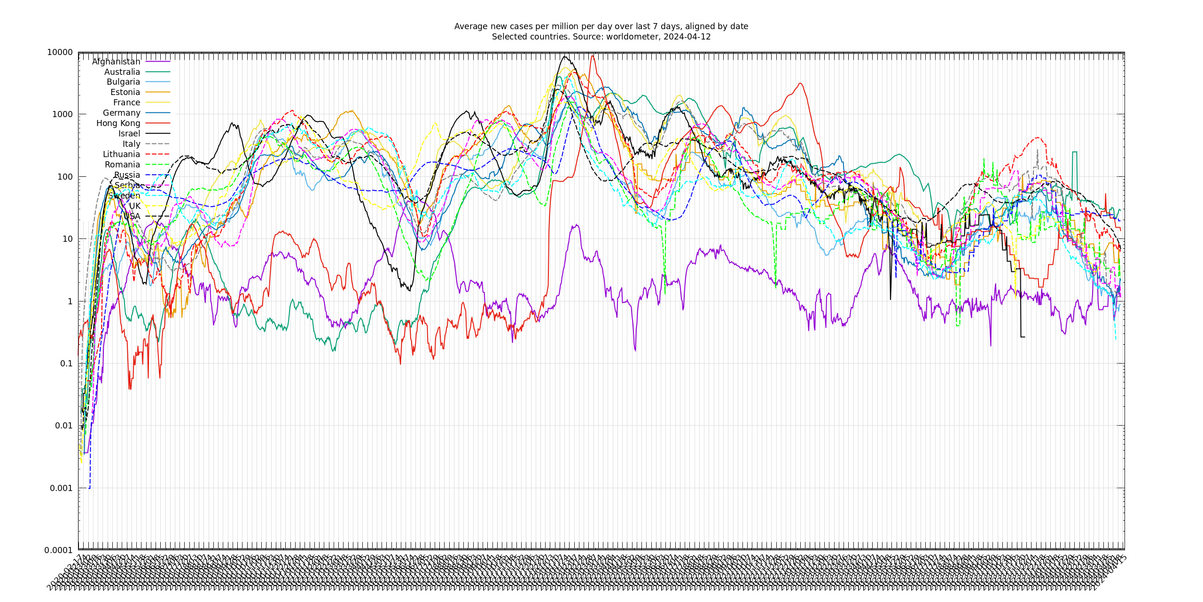
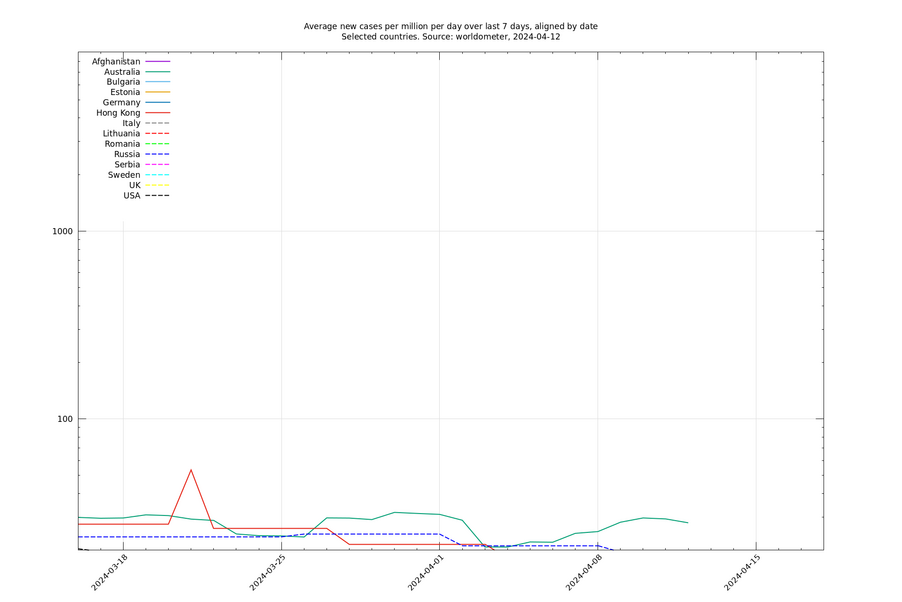
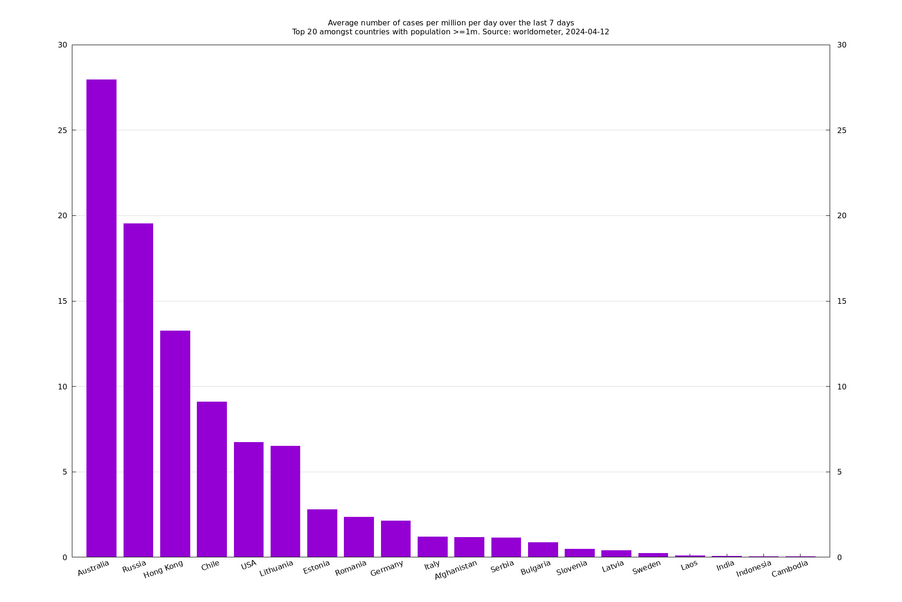
Trend in cases
Made using this and other supporting programs in that repository. Based on Worldometer's daily case and death counts, which are available here in csv form.
