UK variant comparison: Difference between revisions
Jump to navigation
Jump to search
No edit summary |
No edit summary |
||
| Line 1: | Line 1: | ||
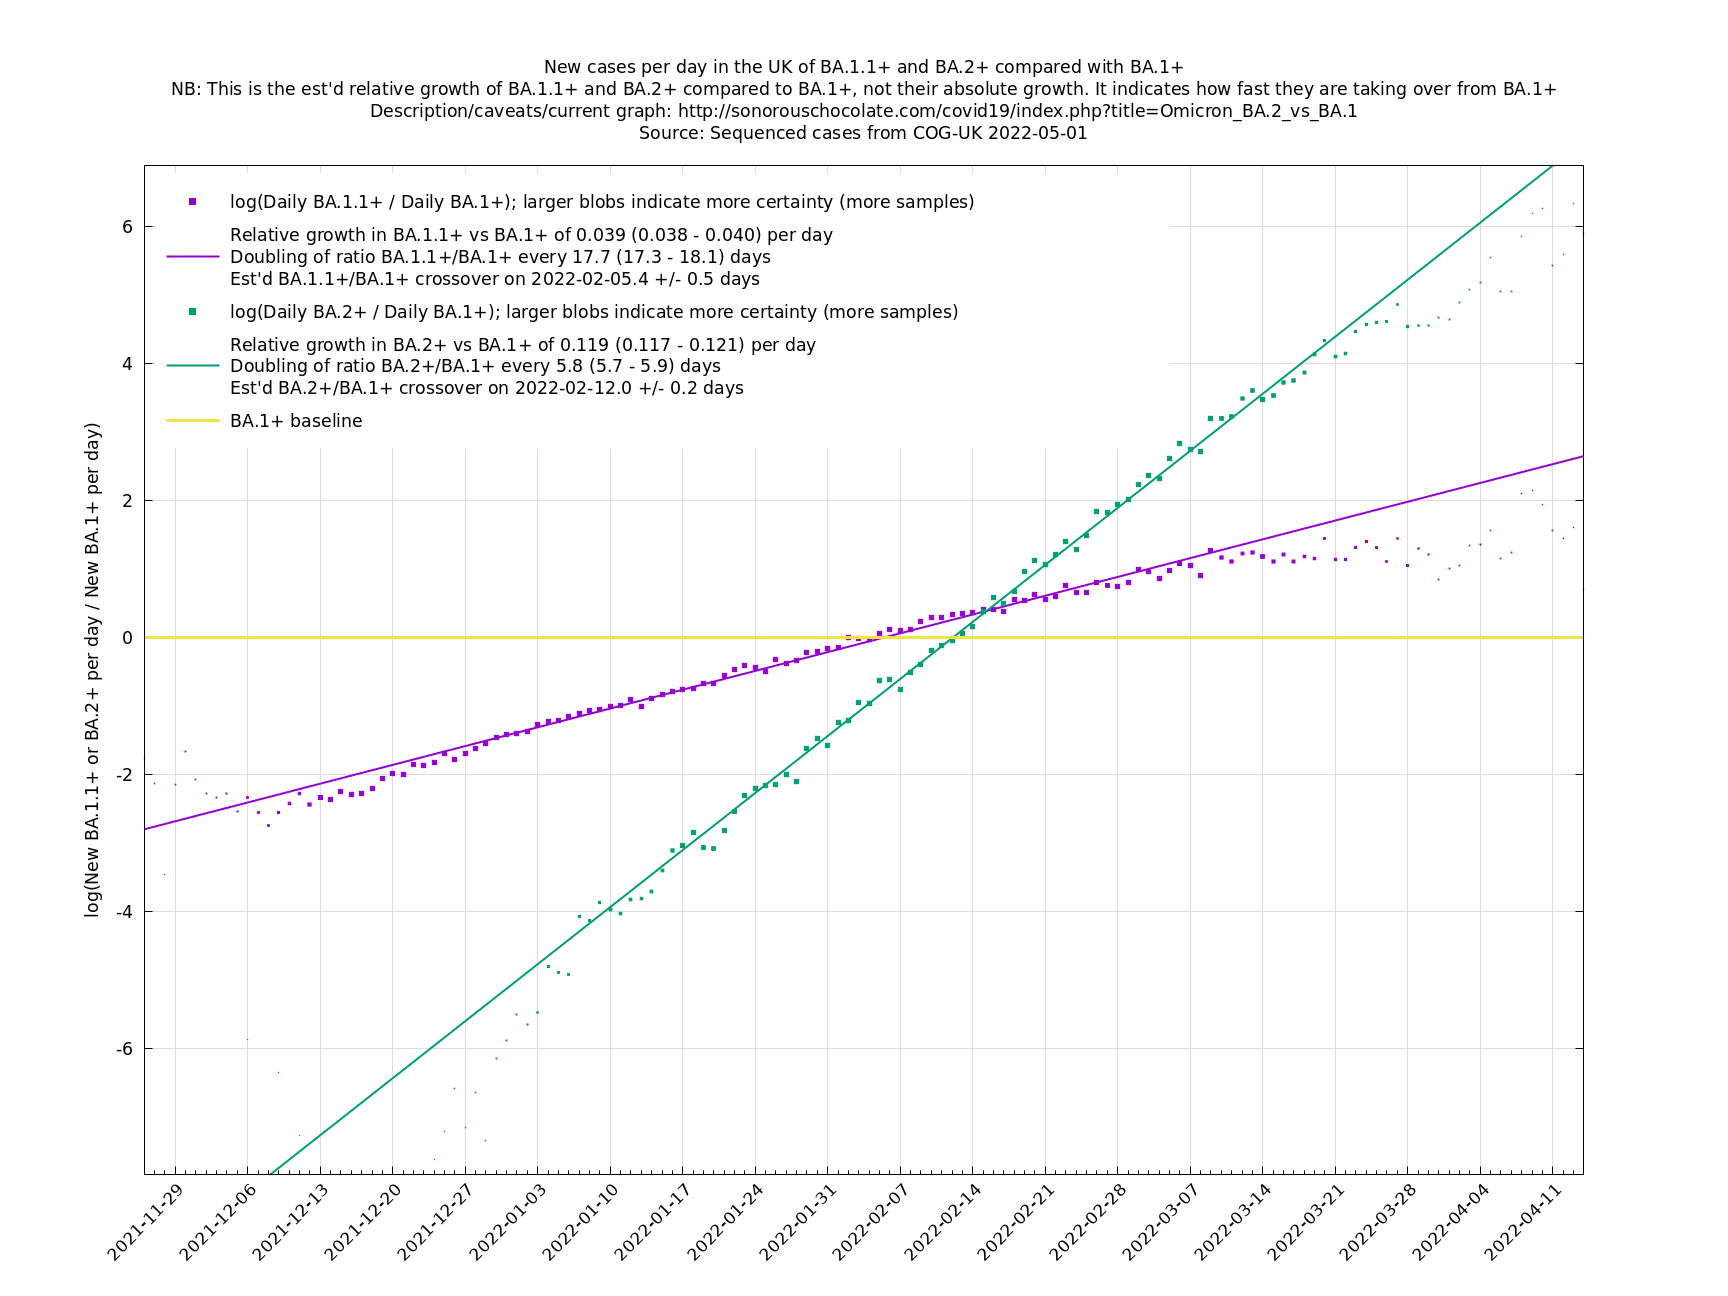
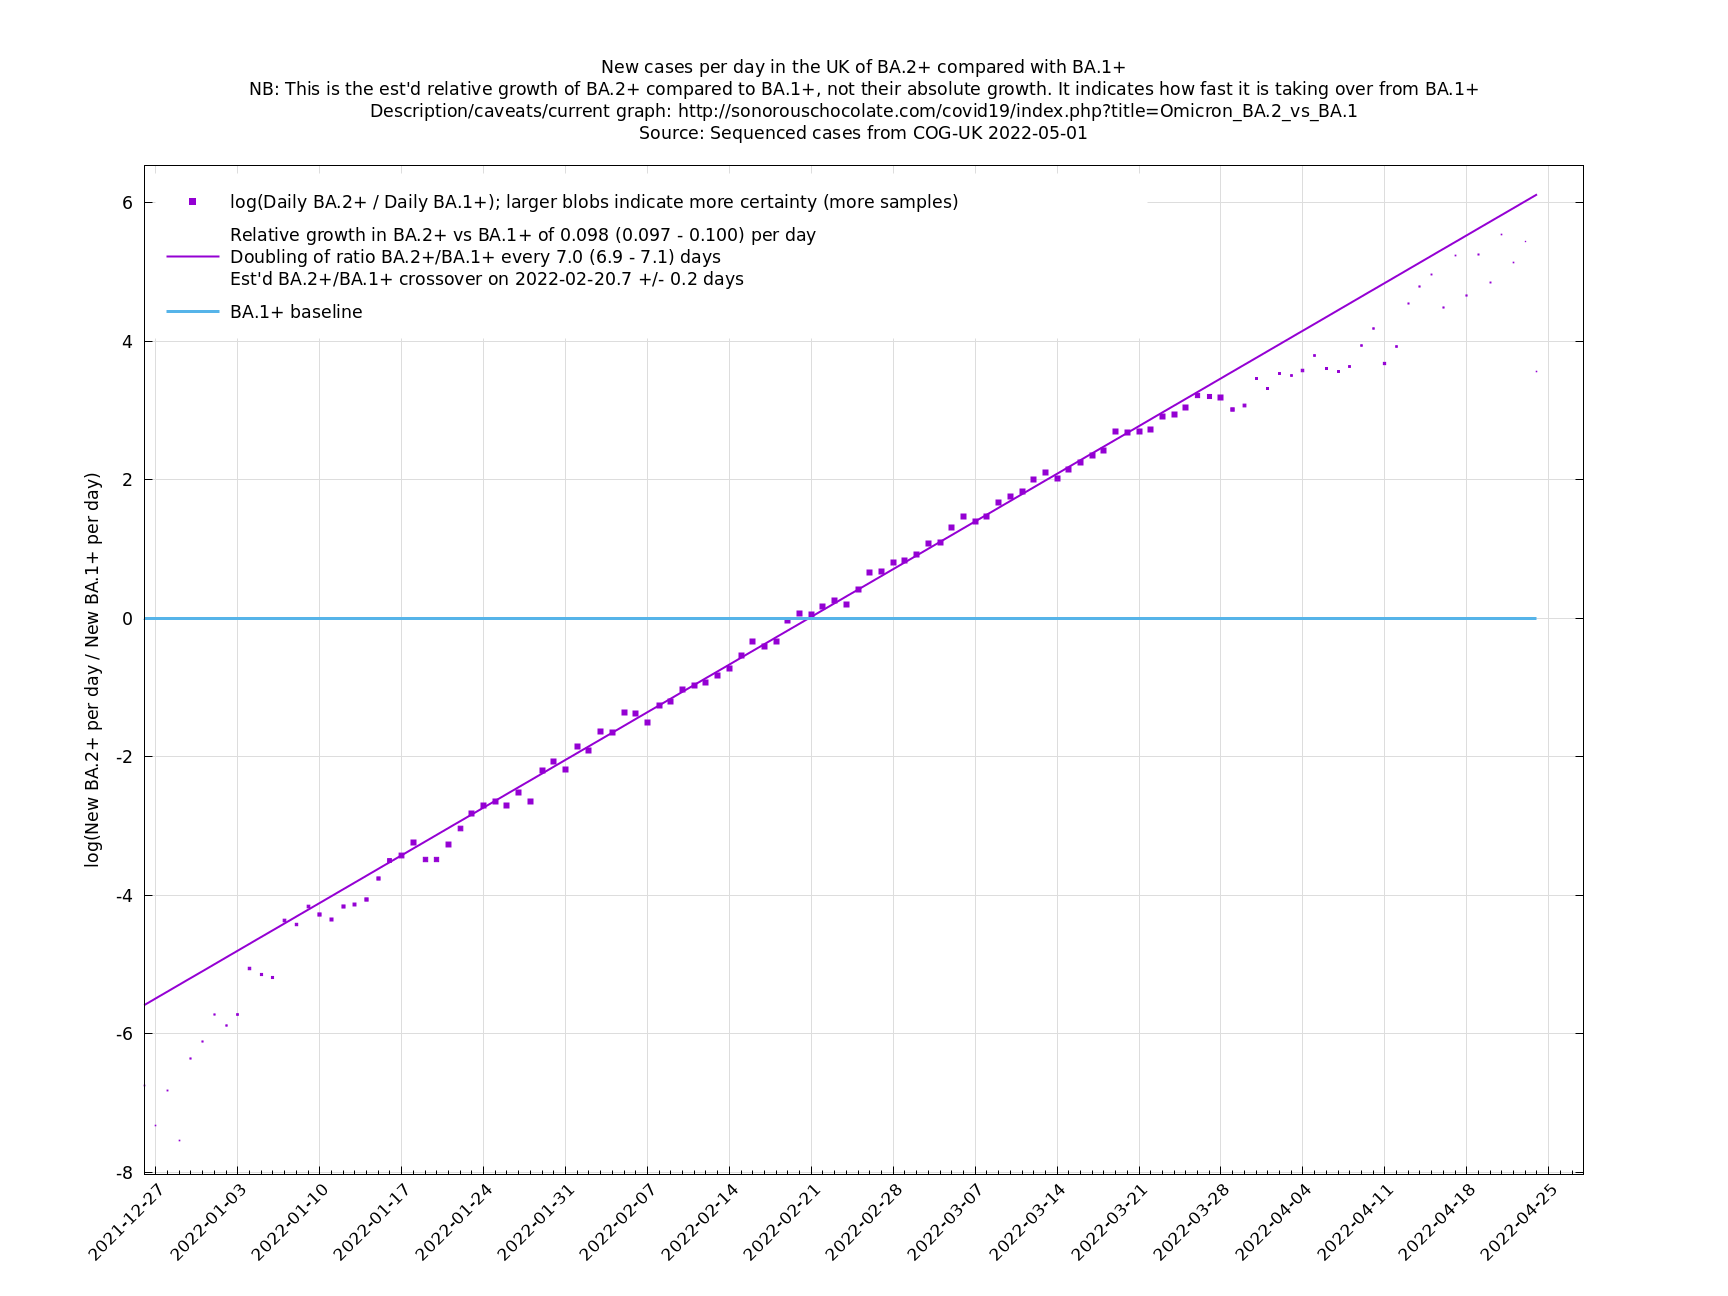
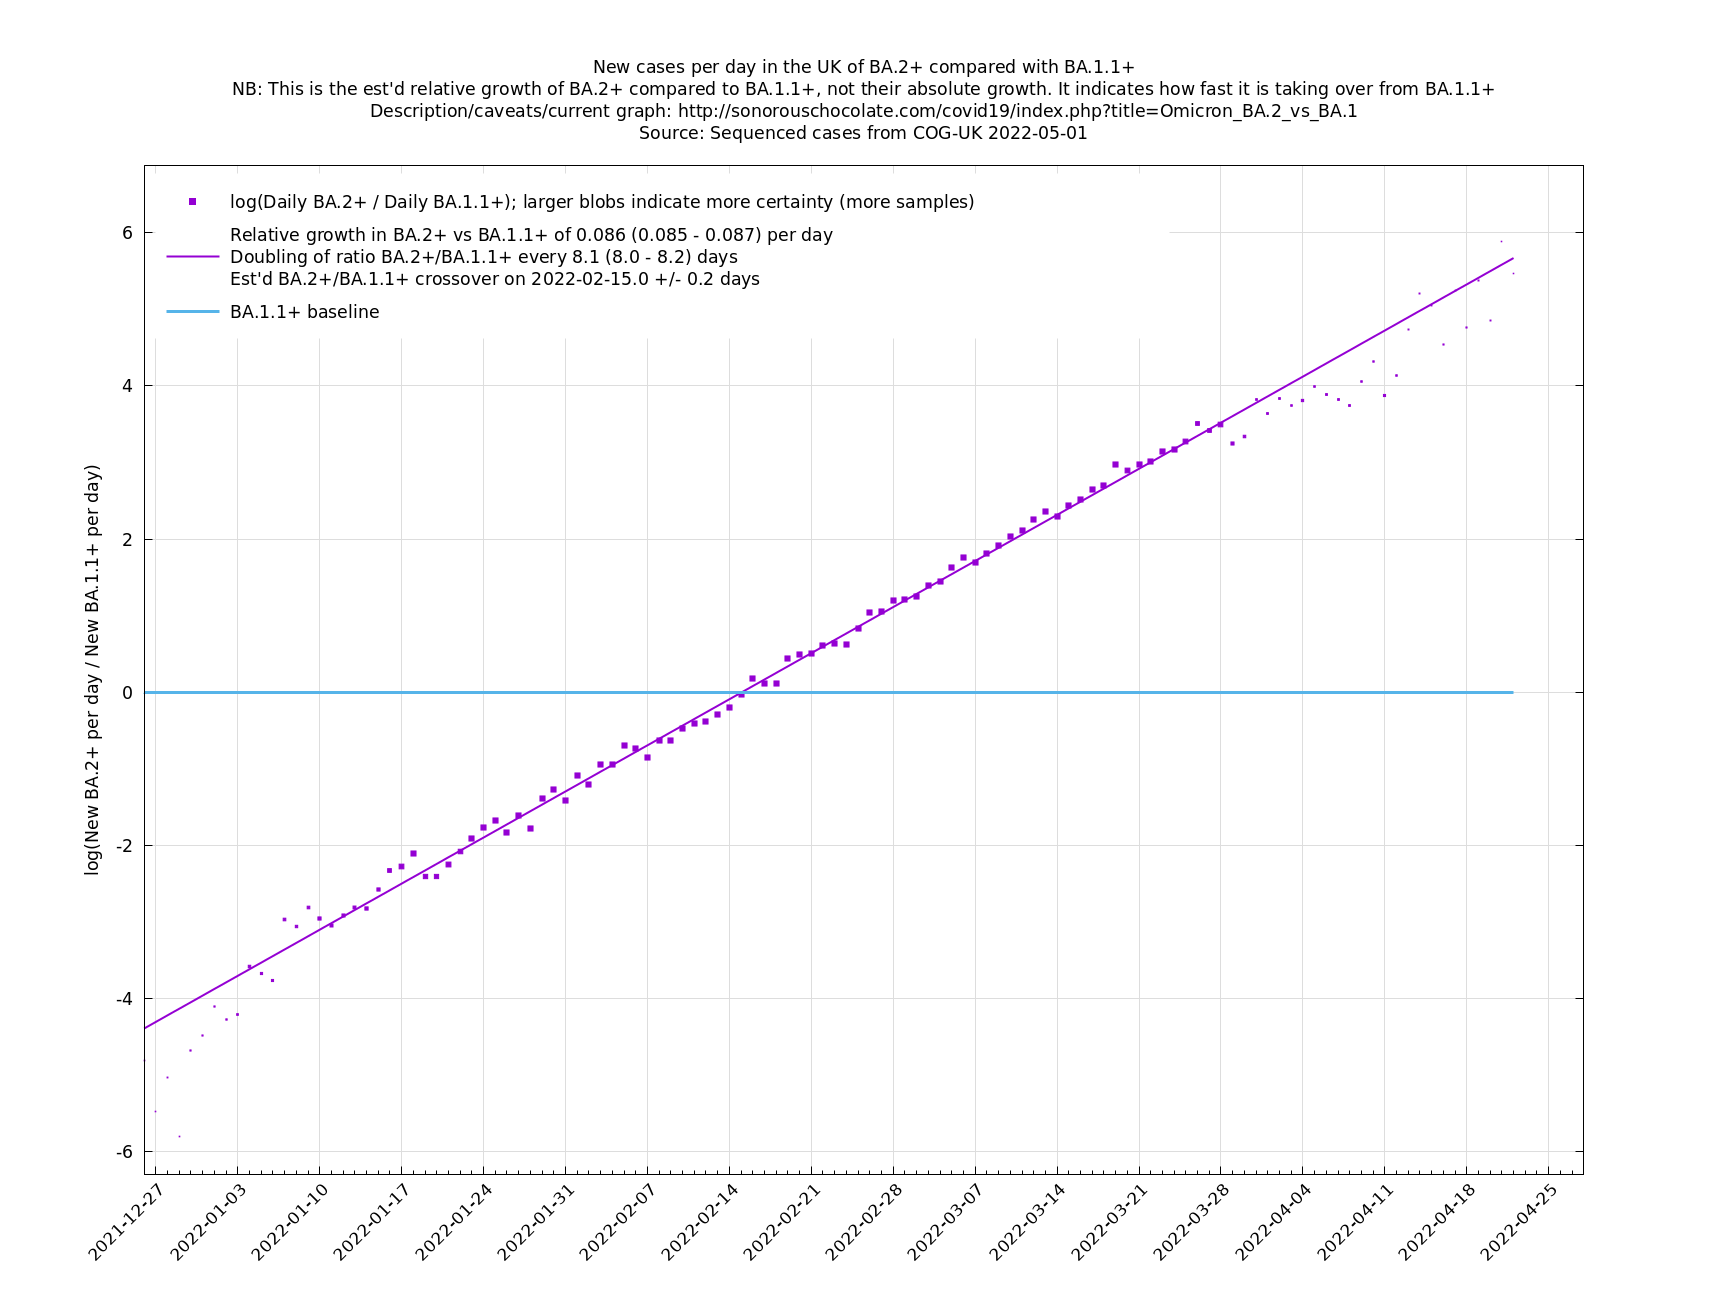
These graphs should auto-update every day or two, according to when there is new sequence data from [https://www.cogconsortium.uk/tools-analysis/public-data-analysis-2/ COG-UK]. You may need to hit shift-reload or some such to defeat your browser's cache. | |||
BA.1 is used as the baseline variant in all three graphs, so a y-co-ordinate of 0 corresponds to equal number of new cases per day of a variant compared to BA.1. | |||
[http://sonorouschocolate.com/covid19/extdata/UK_BA.1_BA.1.1_BA.2.png <img src="http://sonorouschocolate.com/covid19/extdata/UK_BA.1_BA.1.1_BA.2.small.png">] | [http://sonorouschocolate.com/covid19/extdata/UK_BA.1_BA.1.1_BA.2.png <img src="http://sonorouschocolate.com/covid19/extdata/UK_BA.1_BA.1.1_BA.2.small.png">] | ||
| Line 4: | Line 8: | ||
[http://sonorouschocolate.com/covid19/extdata/UK_BA.1.1_BA.2.png <img src="http://sonorouschocolate.com/covid19/extdata/UK_BA.1.1_BA.2.small.png">] | [http://sonorouschocolate.com/covid19/extdata/UK_BA.1.1_BA.2.png <img src="http://sonorouschocolate.com/covid19/extdata/UK_BA.1.1_BA.2.small.png">] | ||
Revision as of 07:28, 27 January 2022
These graphs should auto-update every day or two, according to when there is new sequence data from COG-UK. You may need to hit shift-reload or some such to defeat your browser's cache.
BA.1 is used as the baseline variant in all three graphs, so a y-co-ordinate of 0 corresponds to equal number of new cases per day of a variant compared to BA.1.