Difference between revisions of "Trendgraphs"
Jump to navigation
Jump to search
(Add zoomed in versions of trend graphs) |
|||
| Line 1: | Line 1: | ||
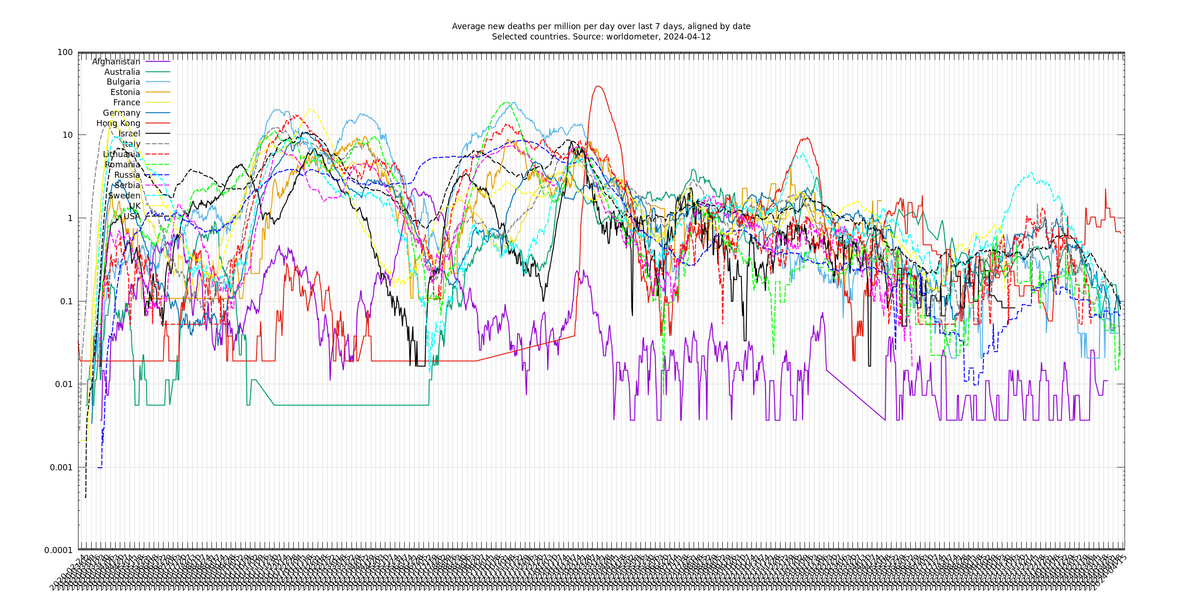
[http://sonorouschocolate.com/covid19/extdata/trendsimple_deaths.png <img src="http://sonorouschocolate.com/covid19/extdata/trendsimple_deaths.small.png">] | [http://sonorouschocolate.com/covid19/extdata/trendsimple_deaths.png <img src="http://sonorouschocolate.com/covid19/extdata/trendsimple_deaths.small.png">] | ||
| + | |||
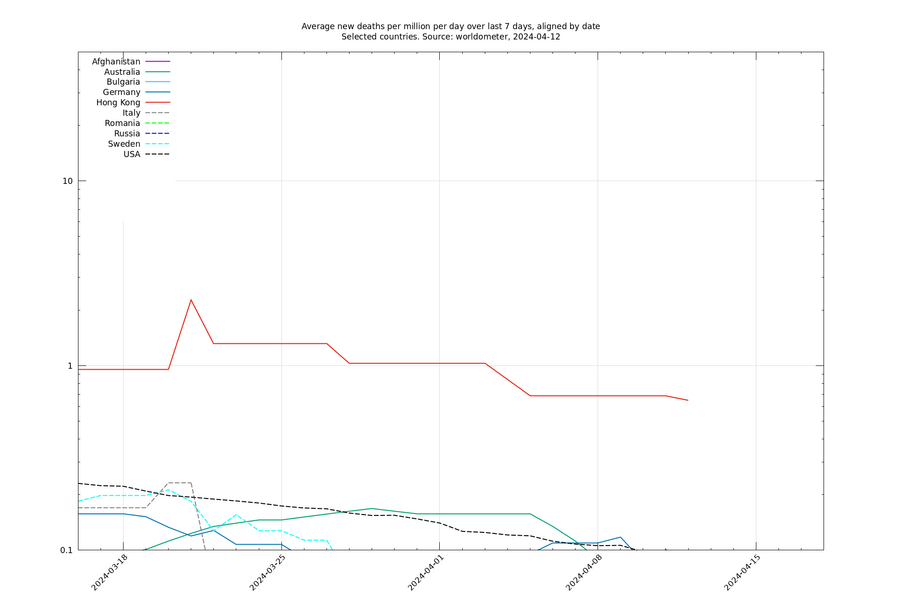
| + | [http://sonorouschocolate.com/covid19/extdata/trendsimple_deaths_zoom.png <img src="http://sonorouschocolate.com/covid19/extdata/trendsimple_deaths_zoom.small.png">] | ||
<!-- | <!-- | ||
| Line 8: | Line 10: | ||
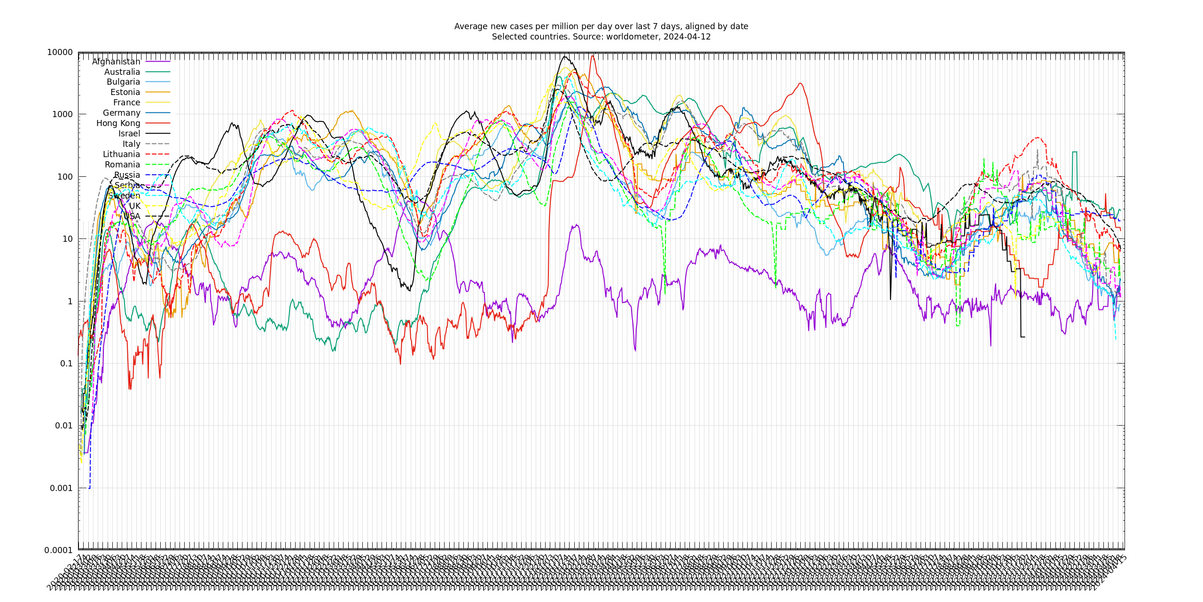
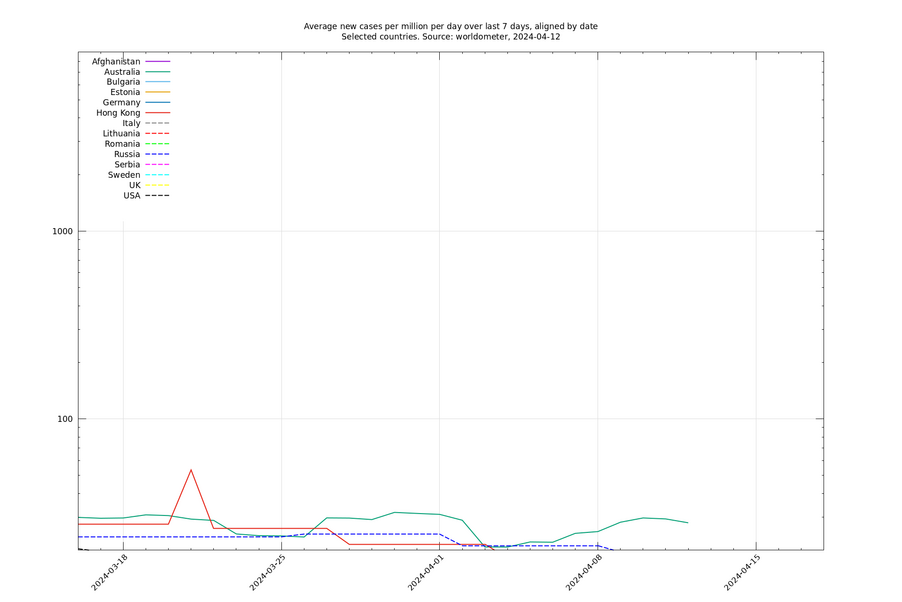
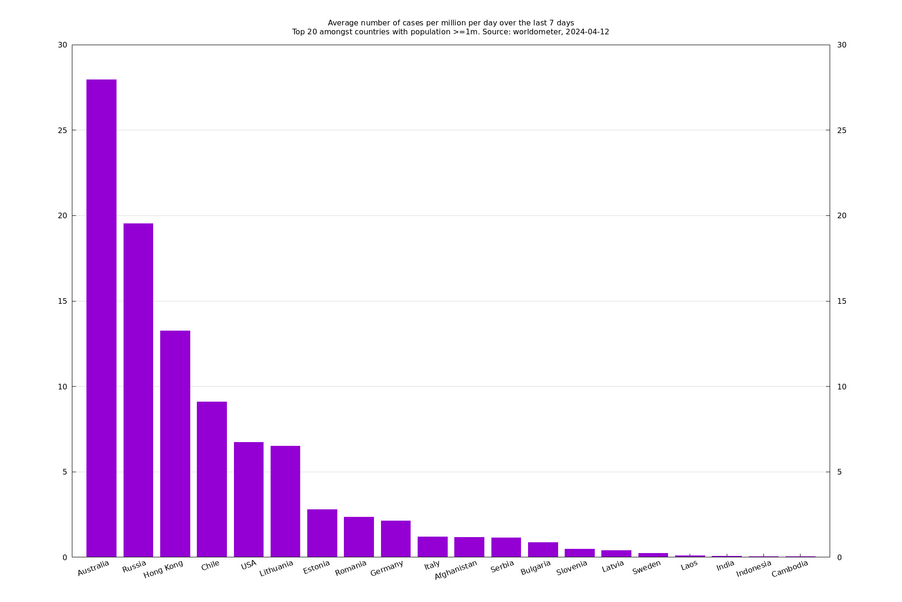
[http://sonorouschocolate.com/covid19/extdata/trendsimple_cases.png <img src="http://sonorouschocolate.com/covid19/extdata/trendsimple_cases.small.png">] | [http://sonorouschocolate.com/covid19/extdata/trendsimple_cases.png <img src="http://sonorouschocolate.com/covid19/extdata/trendsimple_cases.small.png">] | ||
| + | |||
| + | [http://sonorouschocolate.com/covid19/extdata/trendsimple_cases_zoom.png <img src="http://sonorouschocolate.com/covid19/extdata/trendsimple_cases_zoom.small.png">] | ||
<!-- | <!-- | ||
Revision as of 06:58, 26 November 2020
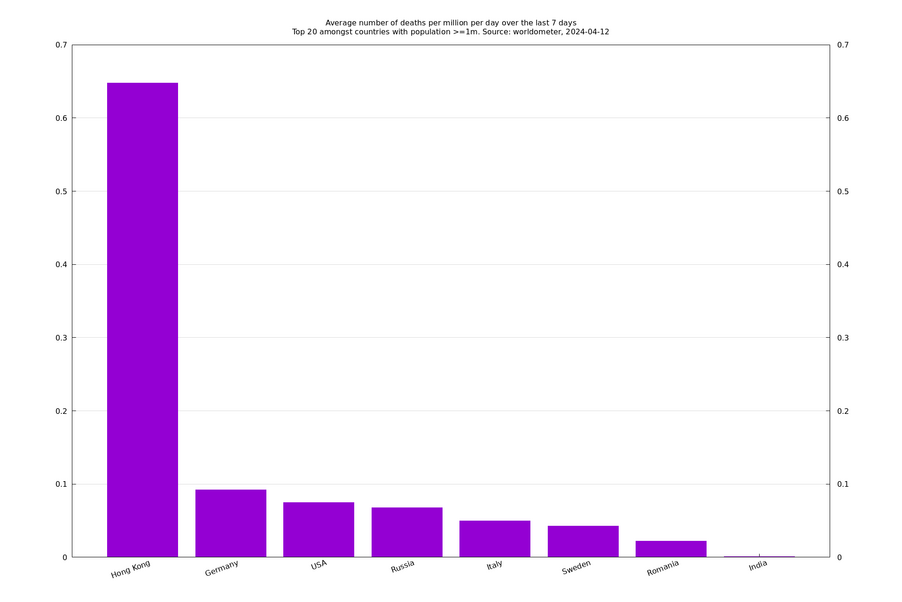
Made using this and other supporting programs in that repository. Based on Worldometer's daily case and death counts, which are available here in csv form.
