Difference between revisions of "Trendgraphs"
Jump to navigation
Jump to search
(Add zoomed in versions of trend graphs) |
|||
| Line 1: | Line 1: | ||
| + | = About = | ||
| + | |||
| + | [[Main_Page|Back to main page]] | ||
| + | |||
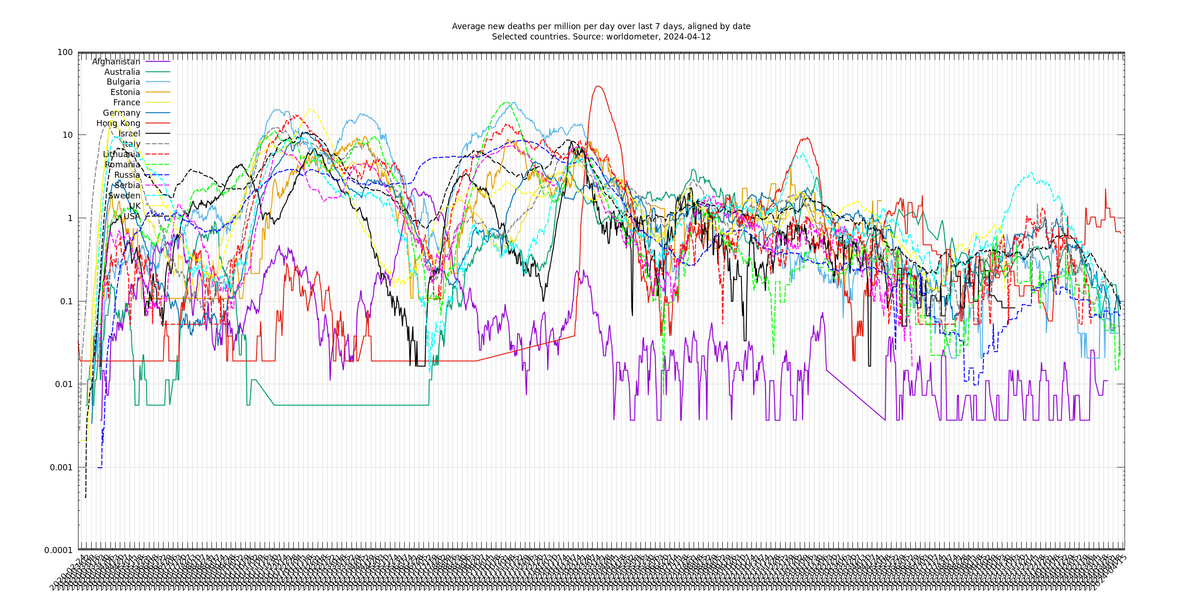
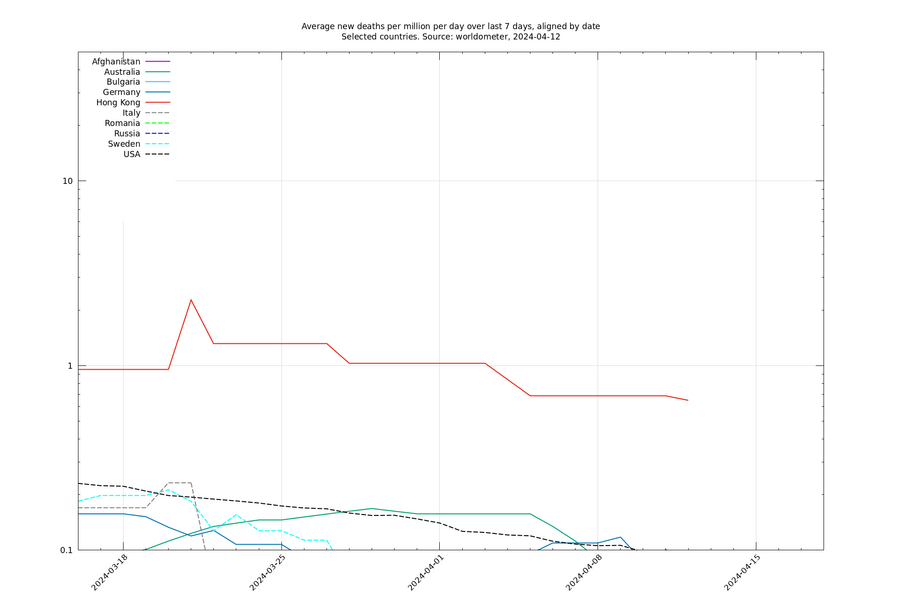
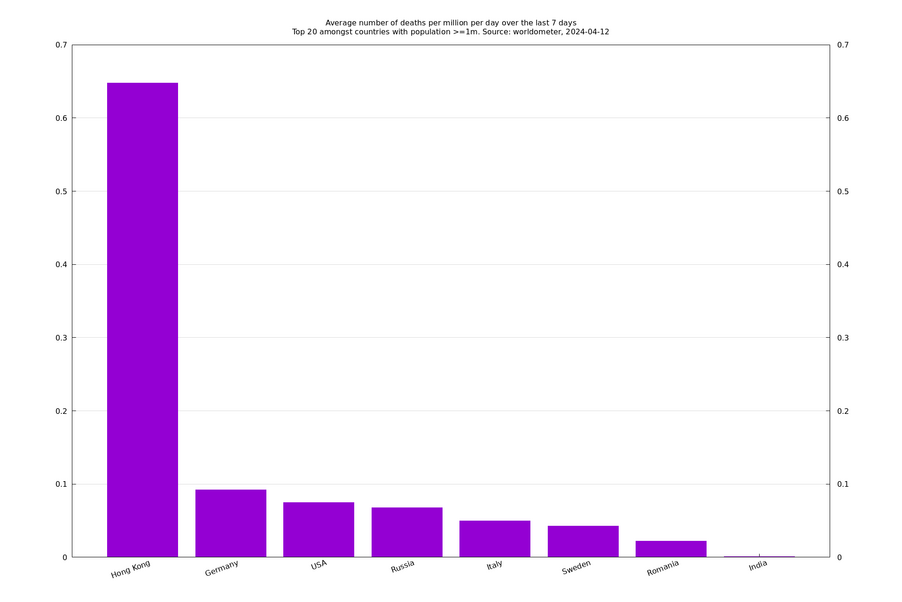
| + | = Trend in deaths = | ||
| + | |||
[http://sonorouschocolate.com/covid19/extdata/trendsimple_deaths.png <img src="http://sonorouschocolate.com/covid19/extdata/trendsimple_deaths.small.png">] | [http://sonorouschocolate.com/covid19/extdata/trendsimple_deaths.png <img src="http://sonorouschocolate.com/covid19/extdata/trendsimple_deaths.small.png">] | ||
| Line 8: | Line 14: | ||
[http://sonorouschocolate.com/covid19/extdata/recent_deaths.png <img src="http://sonorouschocolate.com/covid19/extdata/recent_deaths.small.png">] | [http://sonorouschocolate.com/covid19/extdata/recent_deaths.png <img src="http://sonorouschocolate.com/covid19/extdata/recent_deaths.small.png">] | ||
| + | |||
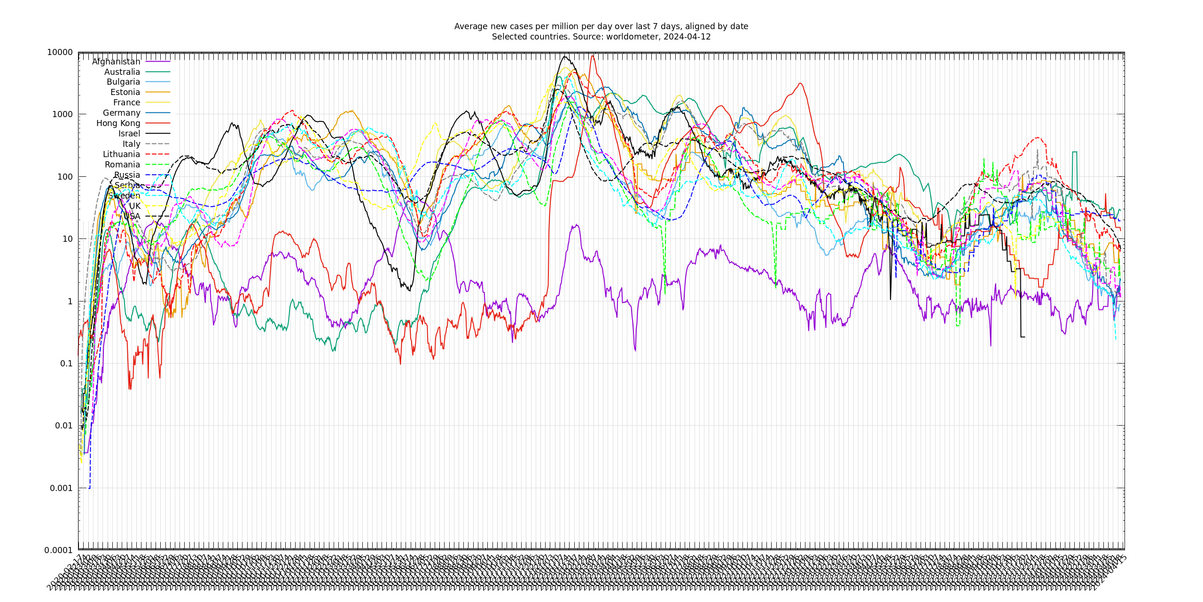
| + | = Trend in cases = | ||
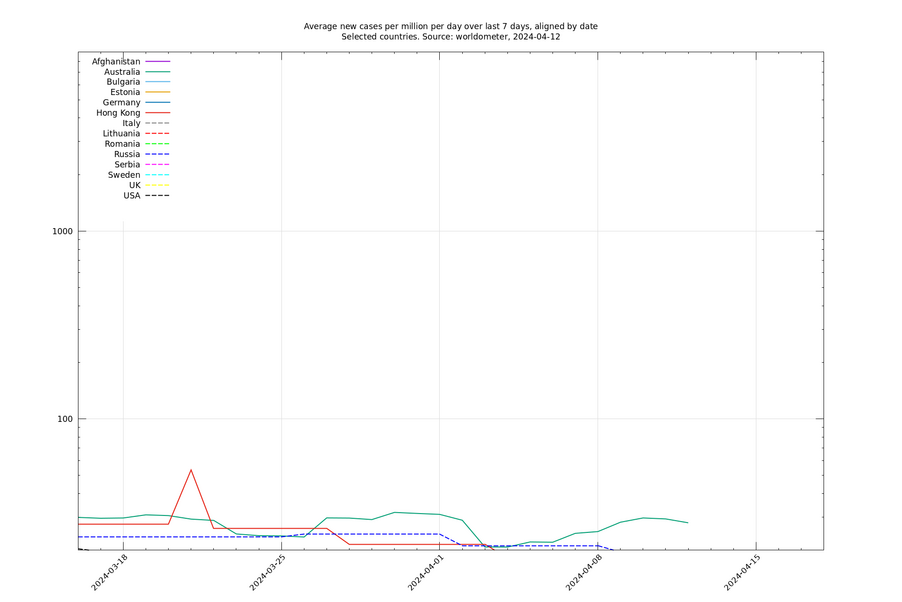
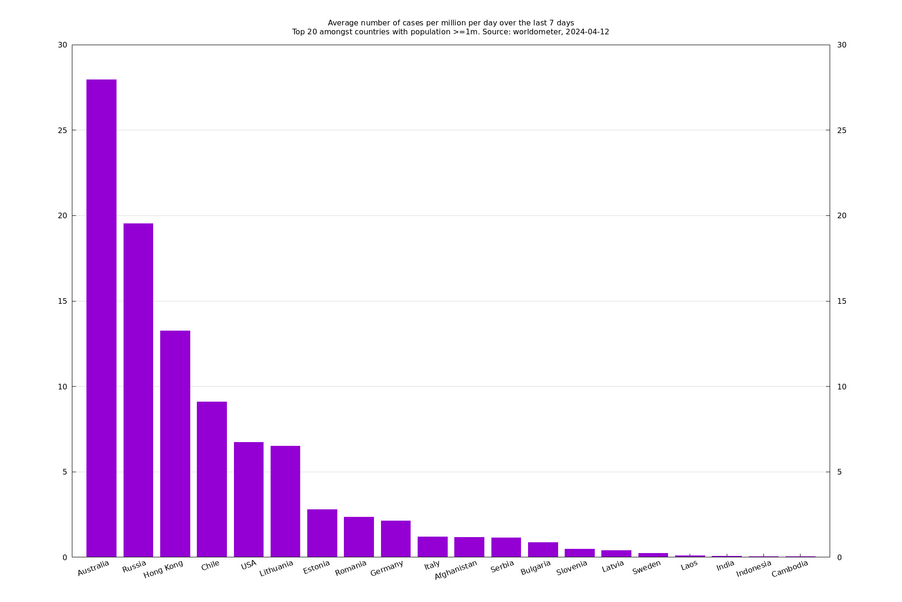
[http://sonorouschocolate.com/covid19/extdata/trendsimple_cases.png <img src="http://sonorouschocolate.com/covid19/extdata/trendsimple_cases.small.png">] | [http://sonorouschocolate.com/covid19/extdata/trendsimple_cases.png <img src="http://sonorouschocolate.com/covid19/extdata/trendsimple_cases.small.png">] | ||
Revision as of 14:03, 6 December 2020
About
Trend in deaths
Trend in cases
Made using this and other supporting programs in that repository. Based on Worldometer's daily case and death counts, which are available here in csv form.
