Hospital Admissions by Age
Redirect to:
Old version - not being updated
Description (written 13 Jan 2021)
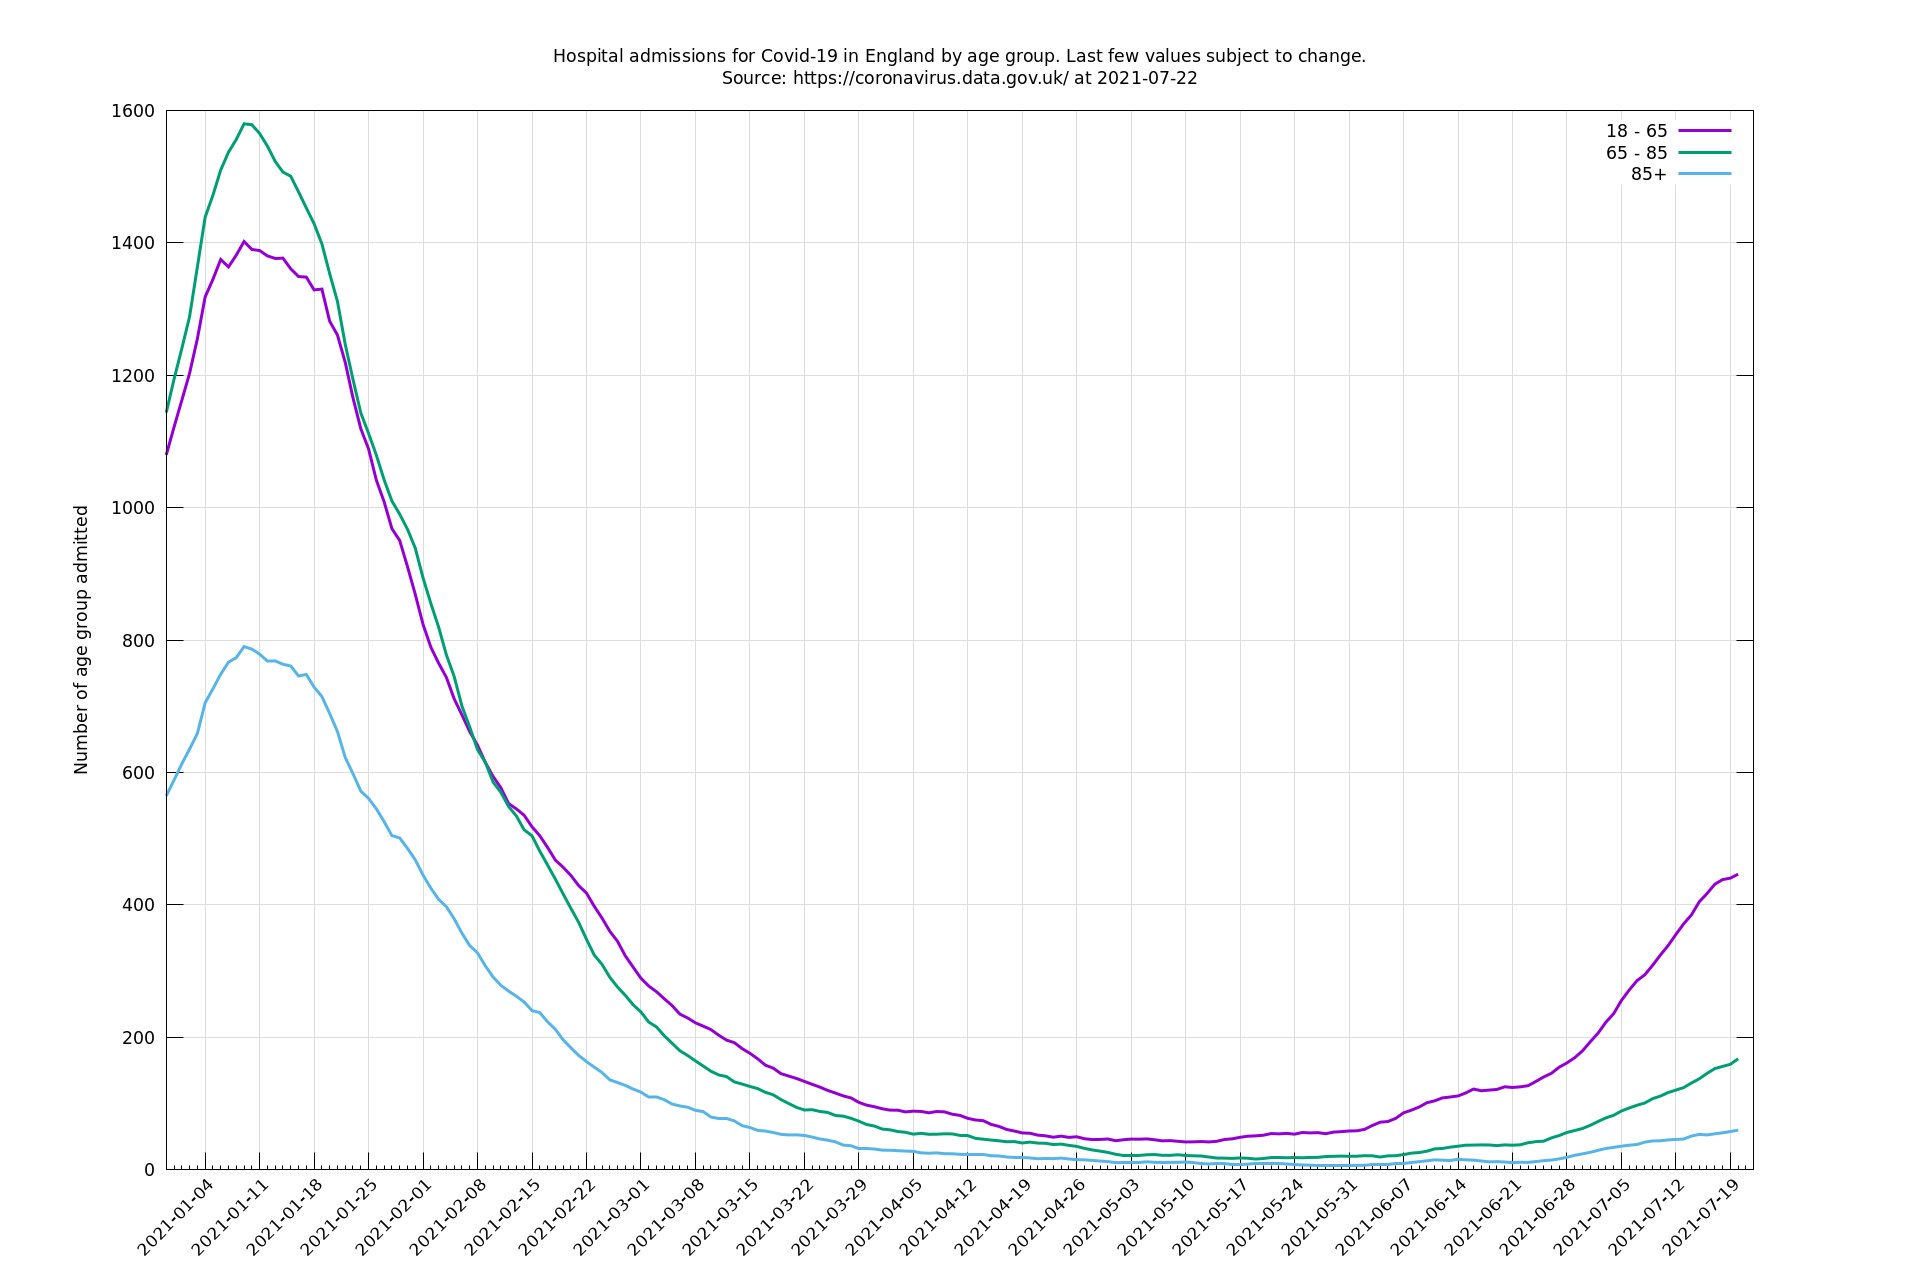
The purpose of this page is to try to see an early sign that vaccines in the UK are working. The the Coronavirus dashboard provides a breakdown of hospital admissions for Covid-19 in England by age groups: 0-5, 6-17, 18-64, 65-84, 85+. The first two groups (0-5, 6-17) aren't shown here because they represent a negligible number of hospital admissions.
Ideally the statistics would be broken down more finely by age so we wouldn't have to lump (mostly vaccinated) 80-84 year olds in with (mostly unvaccinated) 65-80 year olds, but if we exclude this middle group (65-84 year olds), we might expect the proportion: number(85+)/(number(18-64)+number(85+)) - the gold line in the first graph - to be a decent proxy for how well vaccinations are working.
There are possible confounding effects, for example if young people got infected over Christmas and are in the process of passing it on to older people, or if older people having received the vaccine engage in more virus-risky activity, but hopefully the vaccine will be sufficiently effective that regardless of these, the gold line will start to decrease over the next week or two.
Graphs made using this code.

(This graph should update about once a week, depending on when new hospital data is pushed to the Coronavirus dashboard. The last three values may be subject to some retrospective change as a consequence of smoothing that uses future values.)
(This graph should update about once a week, depending on when new hospital data is pushed to the Coronavirus dashboard. The last three values may be subject to some retrospective change as a consequence of smoothing that uses future values.)